Market "Melt-Up" Continues
Authored by Lance Roberts via RealInvestmentAdvice.com,
I want to start with the quote from last week’s missive only because it is so apropos:
“We are so overbought, and this is feeling like a panicky-just-get-me-in buy day. Be careful about being impressed.” – Kevin Muir
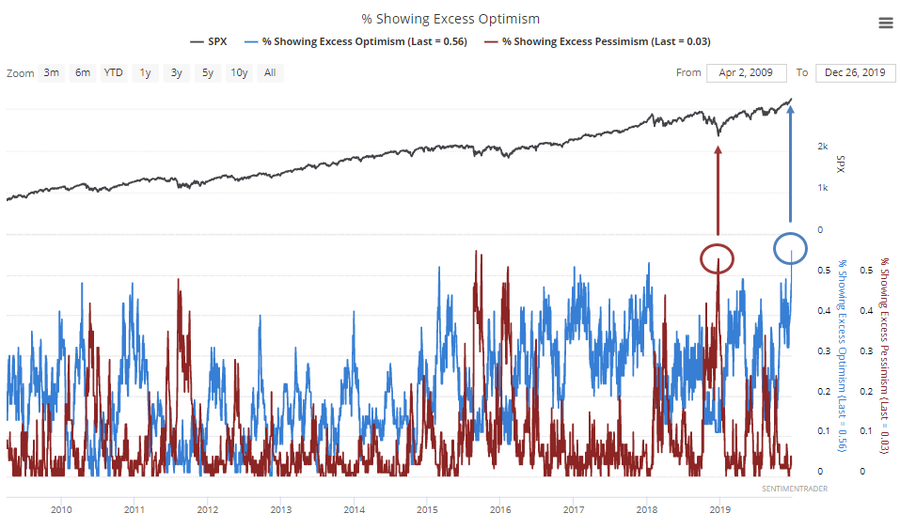
That remains the case again this week as investor optimism has surged to record highs. As noted by Sentiment Trader, this is a marked reversal from just 1-year ago as sentiment plumbed more extreme lows.
Of course, this reversal in optimism should not be a surprise. My pal Victor Adair at Polar Futures group explains this well.
“The most important message from the financial markets in 2019 was, ‘Don’t Fight The Fed.’ The 180 degree turn in Federal Reserve policy…the Powell Pivot…caused markets to realized that it was, once again, ‘All About The Central Banks.’
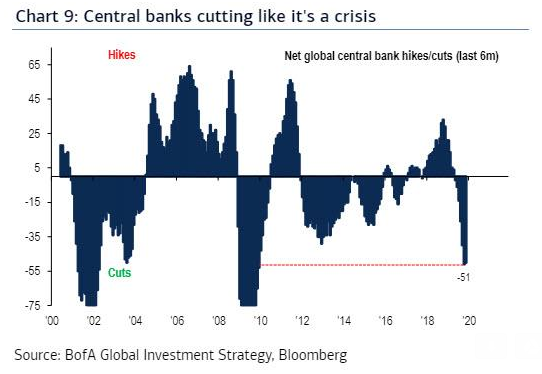
In December 2018 the Fed raised interest rates and indicated that they expected to be raising rates in 2019…but instead of raising rates they cut rates three times…stopped their quantitative tightening policies and wrapped up 2019 by pumping vast amounts of liquidity into the market.
The Fed’s policy reversal inspired Central Banks around the world to step up their own monetary stimulus programs. That global shift to easier monetary policy may or may not have kept the world economy from slipping into recession in 2019…but it certainly helped drive global stock and bond markets to big gains. Bond yields hit All Time Lows, the ‘stack’ of negative yielding bonds soared to a high of ~$17 Trillion and major stock indices kept making ‘New All Time Highs.'”
As I penned last week:
“This stimulus is the largest ever outside of a ‘recession’ or ‘financial crisis,’ which should lead to the obvious question of ‘what exactly is going on we don’t know about?'”
This surge of liquidity is the reason for the markets surge over the last 3-months and was the crux of Friday’s “Morning Market Commentary” which was provided to our RIAPRO subscribers:
“While the media has continued to use the same straw man of trade optimism to justify the rally whatever trade agreement there may actually be was priced in long ago.
The reality is that the Fed’s $500 billion flush of liquidity into year-end to meet short-term funding needs has been interpreted by the markets at “QE.” This interpretation, and subsequent F.O.M.O, led to a rush by managers to benchmark performance and push equity allocations, and subsequently investor optimism, toward record highs.”
This message hasn’t changed over the last week:
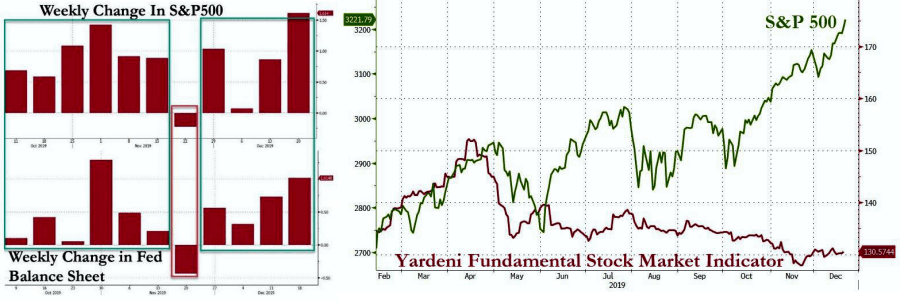
“While the Federal Reserve accurately states this is NOT ‘Quantitative Easing,’ apparently market participants didn’t get the memo. The market has risen in every single week the Fed has been active, despite collapsing fundamentals. (h/t ZeroHedge)”
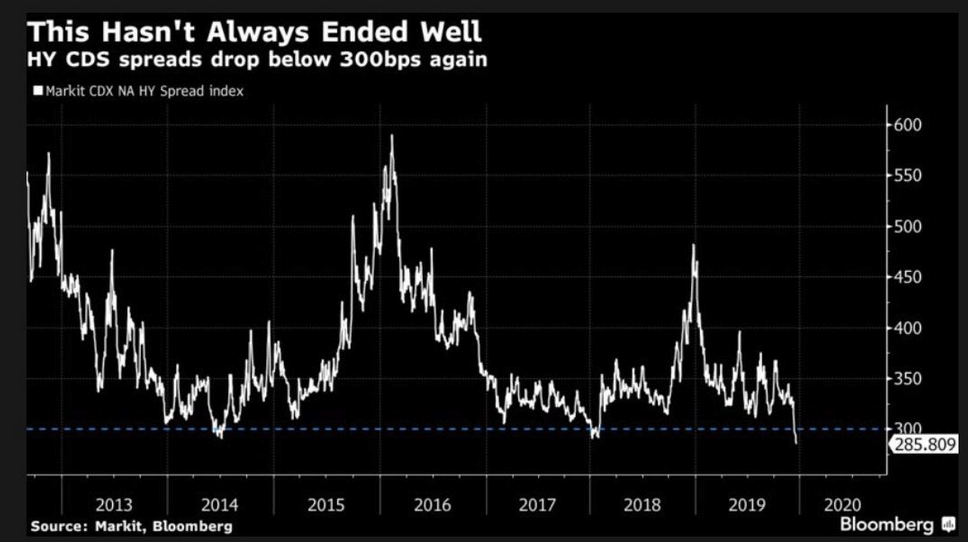
Speaking of optimism, and outright complacency, the difference (spread) between the high yield (junk debt) CDX index and U.S. Treasury yields has fallen back below 300 basis points. The index measures the cost of insuring high yield debt against default. This extremely low cost of insurance, especially this far into an economic expansion, reeks of complacency and a chase for extra yield as we are seeing in other asset markets.
Four Charts That Will Define The Next Decade
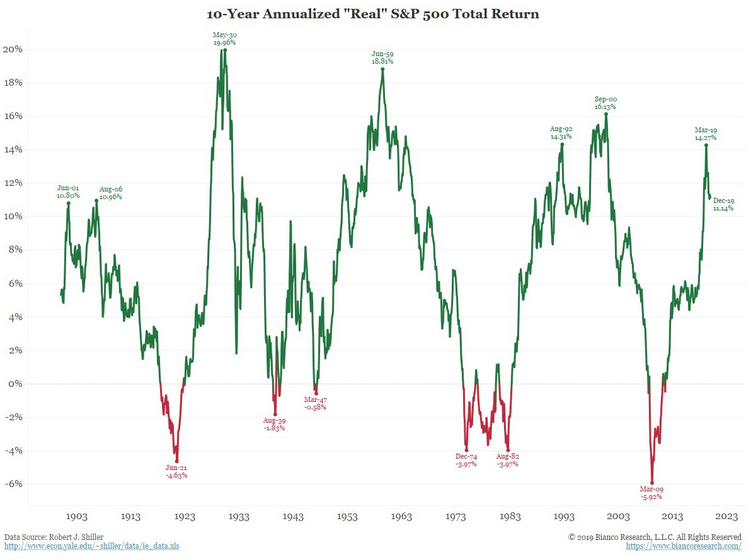
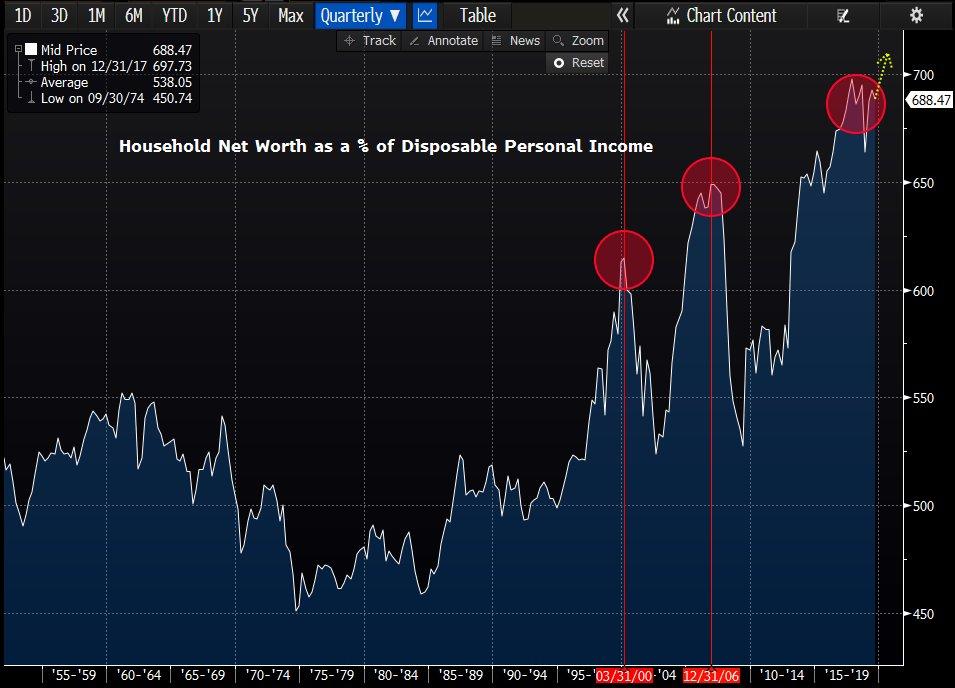
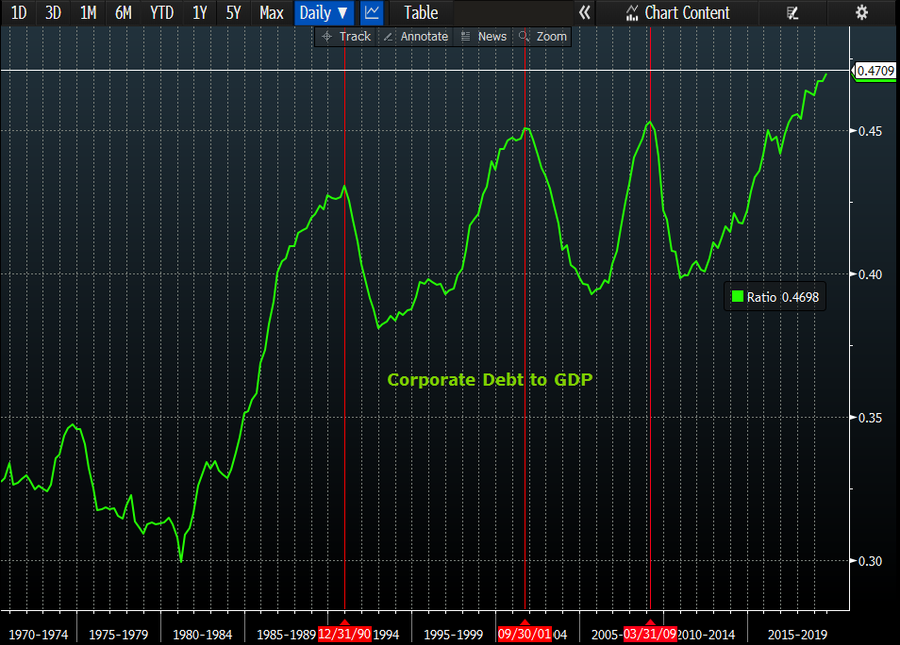
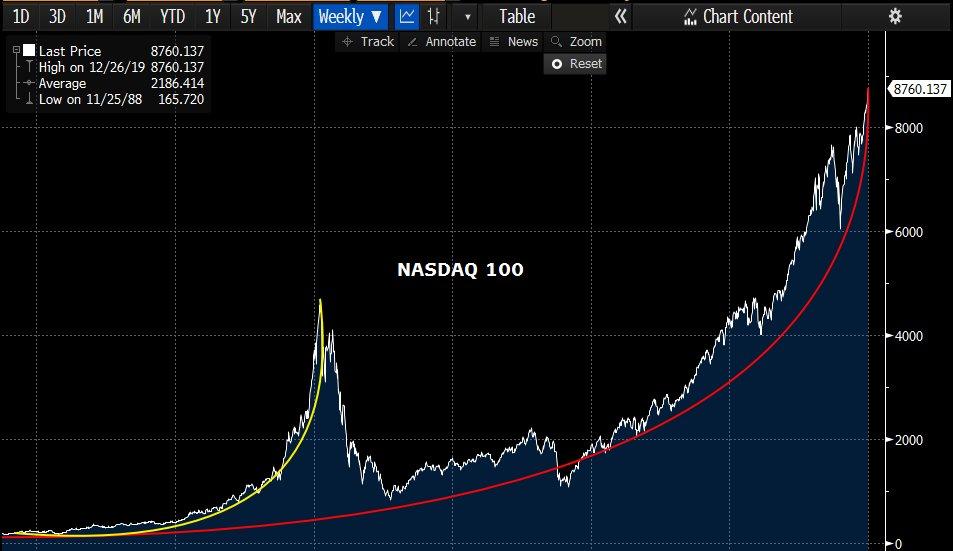
The following four charts were tweeted out by my partner Jack Scott (@jackpscott) which will literally define the next decade.
1 – Annualized Returns are one of the more “mean reverting” series in the financial markets. Decades of high returns are inevitability followed by a subsequent low, and even negative, returns. (If you are close to retirement this is an extremely critical point to understand when it comes to your financial planning.)
2 – Household Net Worth as a Percentage of GDP is pushing record levels. While not in itself a “bad thing,” the benefit has been confined to the top-20% income earners. Importantly, asset growth has far outstripped economic growth which is unsustainable long-term. This series too, will mean revert.
3 – Corporate Debt To GDP is also pushing unsustainable levels. Debt ultimately has to be “cleared” before the system can re-leverage for the next growth cycle. The next reversion cycle will be brutal on a large number of publicly traded companies which have relied on “cheap debt” to sustain poor fundamental business models. Be careful what you own.
4 – Melt-Ups In Markets Can Seem Rational in the heat of the moment. However, when “reality” inserts itself, the eventual reversion tends to be brutal.
What you do with the data is up to you. All I am suggesting is that it took a decade of “fiscal largess” by Central Banks globally to create these extremes. It will likely take a decade to complete a reversion.
Portfolio Positioning
From last week:
“As we have noted over the past year, we have remained primarily allocated toward equity exposure, but have also worked around the edges hedging risk, raising stop levels, and remaining primarily domestic-focused. Given our outlook for a steeper yield curve earlier this year, we also shorted duration in our bond allocations, increased credit quality, and carried a slightly higher than normal level of cash.”
Currently, that remains the case again this week.
In September, we added exposure to Amazon (AMZN) and the Discretionary Sector (XLY) to participate with a “better than expected retail shopping season.”
Not surprisingly, this past week both surged on headlines from the media that retail sales were strong for the Christmas shopping season. However, this is probably not actually the case judging from real “retail sales” which were weak in November and will likely be weak in December. Nonetheless, the positions have performed well and will take profits as the decade ends.
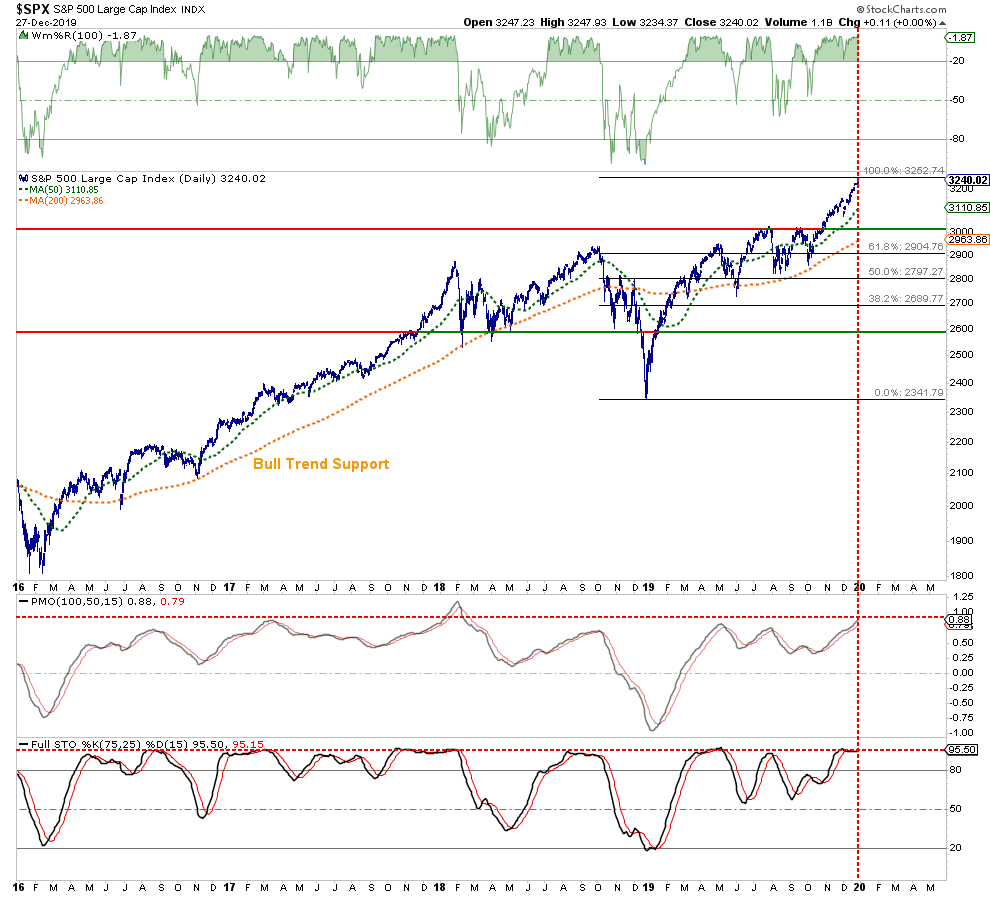
As noted last week, the markets are now even more extremely deviated from long-term trends. Combined with the extreme complacency and excess bullishness (as noted above), the risk of a correction remains high as we move into January or February. (More on this in our MacroView)
As noted below, the market has not been this overbought, extended, and deviated from long-term trends since the peak of the market in 2018. This isn’t necessarily a “bearish” note, but does suggest that the bulk of the gains are currently built into portfolios.
While none of this means the next “bear market” is lurking, it does suggest that a fairly decent 5-10% correction is likely over the next couple of months.
As we head into the final few trading days of the year, it is worth reminding you of “the rules” we penned in last week’s missive. These processes follow our basic rules of portfolio management, which you can apply to your portfolio as well to reduce overall volatility risk.
Tighten up stop-loss levels to current support levels for each position.
Hedge portfolios against major market declines.
Take profits in positions that have been big winners
Sell laggards and losers
Raise cash and rebalance portfolios to target weightings.
Notice, nothing in there says, “sell everything and go to cash.”
Remember, our job as investors is pretty simple – protect our investment capital from short-term destruction, so we can play the long-term investment game.
Of course, if the Fed fails to “extinguish” whatever “blaze” they are currently battling, then we will begin to have a very different conversation about risk, positioning, and liquidity.
https://ift.tt/356ZSV9
from ZeroHedge News https://ift.tt/356ZSV9
via IFTTT




0 comments
Post a Comment