Swiss Watch Exports Are Down 24% In 2020
Submitted by Nicholas Colas of DataTrek Research
Three topics to discuss today: 1: US stock investors expect to make 11% next year according to a NY Fed model of equity risk premia. ERPs have actually been high since 2013 due to persistent investor expectations of higher earnings and low rates. 2020 may have tested that confidence, but it’s still there. #2: US gasoline consumption is rolling over hard as we end 2020, down 15% last week vs. 2020. #3: YTD Swiss watch exports are down 24 percent through November 2020, showing that affluent consumers went into savings mode this year.
* * *
#1: A piece from the NY Federal Reserve out today titled “What’s Up with Stocks?” by MIT PhD and Fed staffer Fernando Duarte caught our eye. The author leads off with seeming dichotomy of a strong year for US equites against the backdrop of the virus, but the bulk of his work relates to how investor expectations for future returns helps explain that phenomenon.
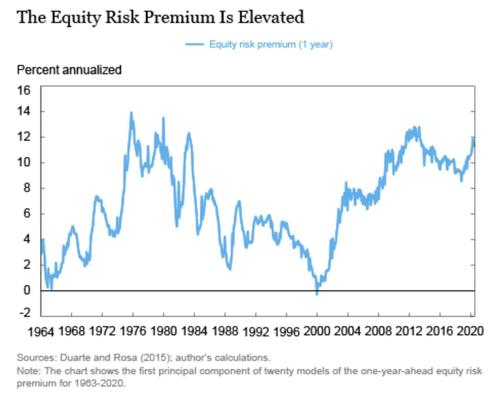
The most useful bit of this article is the chart below, an estimate of the 1-year equity risk premium (ERP) imbedded in the S&P 500 back to 1964. This is simply what investors expect to make owning the index over the next year, calculated in a variety of ways.
What’s particularly useful about this specific calculation of ERP is that it amalgamates 20 different ERP models used in academia and among practitioners. There is a link below to the article where you can read more, and the model itself has been out there for several years (Duarte and Ross, 2015).
Three points about this graph:
- ERP estimates don’t always get it right. The best 4-year return sequence in the whole time series was 1995 – 1999 (just past the half way point of the graph), when the ERP was 2-4 percent but stocks compounded at 26 percent annually (not a typo).
- More recently, the ERP as calculated by this model has been fairly predictive. The author focuses on the 2013 – 2020 period in the article (that hump in the ERP data on the right side of the graph above), showing that expected stock returns rose to +12 percent in 2013 and stocks actually did compound at 15 percent/year for the next 5 years.
- The author describes direction of the ERP (higher or lower) as a tug of war between market confidence in higher earnings and worries over higher interest rates. ERP tends to be highest when investors believe earnings will increase but rates will stay low. Which is 1) pretty much consensus for 2021 and 2) a great explanation for the last decade’s solid equity returns.
Takeaway: ultimately, what we really like about this analysis is that it treats 2020’s unusually strong returns as being built on a foundation of investor expectations that was actually in place as far back as 2013. The underlying principle is that expected returns are, and have remained, high because investors see corporate earnings improving and rates staying low. As long as that psychology remains unshaken, stocks have a chance of generating the sorts of high returns investors currently expect. But make no mistake: this is a very specific formula.
* * *
#2: An update on US gasoline demand as a proxy for general economic activity.
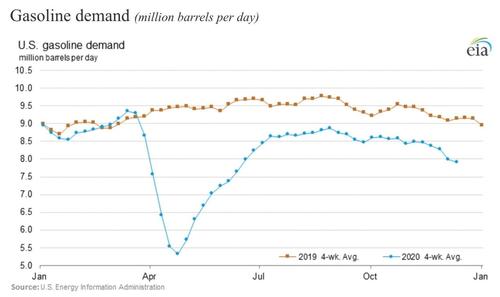
This chart from the US Energy Information Agency shows daily American gasoline demand in millions of barrels/day for all of 2019 (brown line towards the top of the graph) as compared to this year (blue line, mostly below the brown line):
Two points on this chart:
- We can look at how far apart 2019’s brown line is from 2020’s blue line to assess how much the US economy has recovered from the Pandemic Recession. For example, in April 2020 gas consumption was 48 percent below April 2019. By September it was only 9 percent below 2019’s run rate for the same month.
- The 2019 – 2020 gap is, however, widening again. For the trailing 4 weeks, the difference is now 13% and over just the last week (ending 12/13), demand is 15% lower.
Takeaway: gasoline demand is one of the inputs into high frequency econometric models like the NY Fed Weekly Economic Indicator, so it’s instructive to know it is rolling over. Thus far markets seem to be looking through a Q1 2021 economic valley, but this data shows we may already be beginning our descent.
* * *
#3: Swiss watch shipments as global economic indicator. This is one of our favorite “tells” about how different economies and their more affluent consumers are really doing. A few data points to frame today’s discussion:
- High end mechanical watches are the vast majority of total shipments out of Switzerland measured by value (84 percent of the Sfr 14.5 bn/$12.8 bn in total exports). The average Swiss mechanical watch shipped this year wholesales for $2,880.
- The 5 largest markets this year through November are: China (14 percent of global shipments), the US (12 pct), Hong Kong (10 pct), the United Kingdom (6 pct) and Singapore (6 pct). Throw in Germany, the 6th largest market at 5 percent, and you have 53 percent of the global market for Swiss watches by value.
So, how have Swiss watch shipments fared in 2020?
- China is the only top-20 market for Swiss watches that is actually up in 2020. Shipments are +17.1 percent in Swiss franc terms through November.
- If you count Hong Kong in the China figures, however, then aggregate shipments for the 2 geographies are actually down 15 percent for 2020 through November.
- That is still better, however, than any other major market YTD. Shipments to the US are down 19 percent in value terms, down 28 percent to Japan, down 25 percent to the UK, down 28 percent to Singapore, and down 22 percent to Germany.
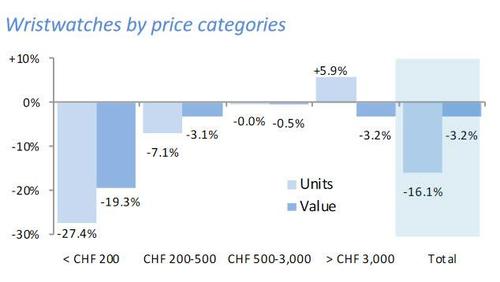
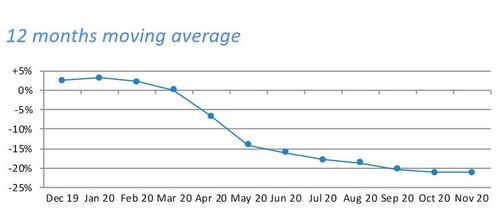
- Total global demand for Swiss watches is down 24 percent in Swiss franc terms through November 2020 as compared to the same period in 2019.
Takeaway: while affluent consumers around the world may be doing better than their less-fortunate counterparts, they are not spending as if the worst of the global economic downturn is over. This is actually a positive as we look forward to 2021, since it represents potential pent-up demand for a range of goods and services (not just watches).
Sources:
NY Fed Paper on Equity Risk Premium: https://libertystreeteconomics.newyorkfed.org/2020/12/whats-up-with-stocks.html
US EIA Gasoline Consumption (last chart on page): https://www.eia.gov/petroleum/weekly/gasoline.php
Swiss watch exports: https://www.fhs.swiss/eng/statistics.html
https://ift.tt/2WIZOJi
from ZeroHedge News https://ift.tt/2WIZOJi
via IFTTT


0 comments
Post a Comment