Will The Market Flip Green This Week? Here Are The 15 Things On Goldman's Checklist
Goldman's flow trader Scott Rubner called the year-end meltup and Santa Rally with perfect accuracy, although his call for a continuation of the meltup into January and the new year has so far proven painfully wrong. And with sentiment imploding over the past three weeks, turning from euphoric to cataclysmic in just a matter of days, it is hardly surprising that in his latest Tactical Flow of Funds note (available to professional subs), the Goldman trader writes that consensus has turned uniformly bearish, with accounts worried that the Fed will keep on tightening into a market swoon, and will only cover shorts when the Fed "blinks" with expectations that this won't really happen until at least March, to wit:
I have done more Zoom calls, IB side chats, emails, with convicted bearish investors than I have in a very long time. The summary of the call started with, "we need to tighten financial conditions and I will cover my short when the Fed blinks." The expectation was to maintain some sort of US portfolio short position until March.
On the other hand, in a market as confused as this, the conviction level of the shorts falters when they start discussing what others may be thinking, or as Rubner puts it "what does consensus really think about the consensus", and here is the answer:
In the exact same level of conviction was: “Where can I go wrong in the short thesis”? “What are other shorts thinking” “Can you lay out the triggers for a potential cover bid next week”? “Is there enough liquidity for me to cover”?
Rubner then points out the one thing that surprised him the most on zoom calls with bears this week: optimism over China (something premium readers had an advance look into two weeks ago in "As Beijing Finally Freaks Out About Its Crashing Property Market, A Key Trade Emerges")
The same bearish investors who are short Nasdaq and short S&P by construction, are very bullish on China Policy. A bullish Emerging Market equity trade expression was discussed on every call. We have executed more domestic China on-shore trades (inclusive of both China-internet calls and banks), long Brazilian Equities (commodity exporters), EM custom slices (EM rate hiking trades), than pre-covid.
With that introduction behind us, Rubner looks back on the 3rd week of the year, as well as forward to the coming week, and reveals his US Market Structure Checklist, which "has come up on every single one of my calls this week" and which he has sorted by order of impact and importance. This is what he writes: "As I check the box, I see Red light’s flashing into expiry today and potentially on Monday ("watching Sunday night futures again”). I see the conditions in place for a large cover rally into and around the FED next week and when month-end new capital comes back into the equity markets, with corporates dry powder."
So without further ado, here are the 15 things that the Goldman trader is checking off his list to flip green:
Bucket 1: US Equity Market Construction: Impact Market on close.
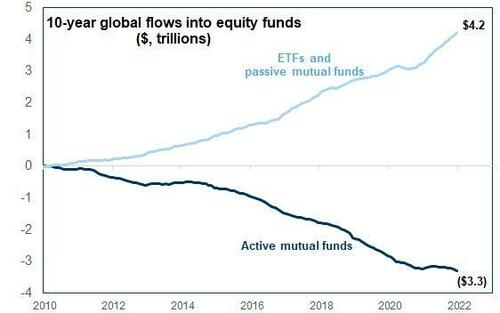
1. Passive ETF Redemptions is the most important dynamic in the market place today. USA Passive Funds are now logging outflows this is new, while every other global market is logging inflows.
2. Market on close imbalances (the last ~30 minutes of trading and especially when S&P gets posted at 3:50pm and NDX at 3:55pm). There are 2,844 ETF’s that are listed in the US.
- a) SPY has seen the largest outflows out of any ETF YTD (-$14.1B worth of redemptions) = rank 2,844/2,844 YTD
- b) IVV has seen the second largest outflows out of any ETF YTD (-$4.60B worth of redemptions) = rank 2,843/2,844 YTD
- c) QQQ has seen the third largest outflows out of any ETF YTD (-$4.40B worth of redemptions) = rank 2,842/2,844 YTD
- d) Next you have credit and treasury redemptions, which I get an expect more of: (HYG/TLT).
- e) IWM has seen the sixth largest outflows out of any ETF YTD (-$2.7B worth of redemptions) – note Lou Miller and team have a juiced up IWM short.
As a reminder, ETF sell = “you ask me for money, I sell”. In S&P for example, for every $1 redemption, that is selling 7c in AAPL, 7c in MSFT, 4 c in GOOG(L), 4c in AMZN, 2c in TSLA, 2c in FB. (26 cents of every $1 in the top 6 stocks). And this is 46 cents of every $1 in QQQ among the top 6 stocks. If you are a live market tick watcher (the MOC imbalances for sale get posted at 3:50pm EST), big redemptions in the biggest caps, means late day unwinds.
This is interesting. This $$$ is being deployed into (Financials, the total stock market, Energy, Value, Ex-US). This are the smallest segments of market cap (and impacts flows into sector specific trades, but not the broad based index level).
* * *
Bucket 2: Retail Traders: Impact no dip buying, no weekly call option buying, no taking street short single name upside gamma
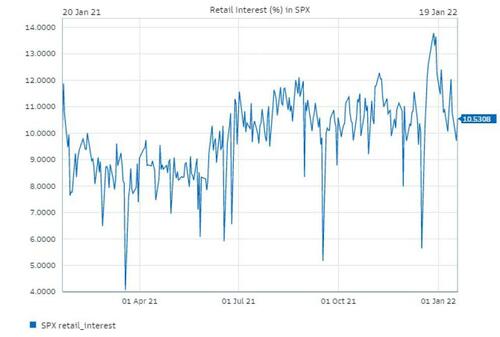
3. Retail Outflows are starting for the first time since opening accounts. Volumes have declined on both index and favorite trading stocks. All eyes on the 1-year anniversary of “GME” next week.
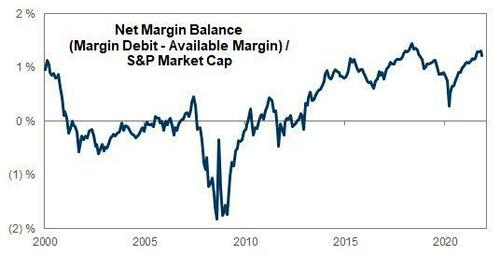
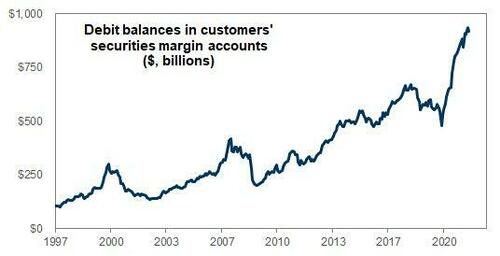
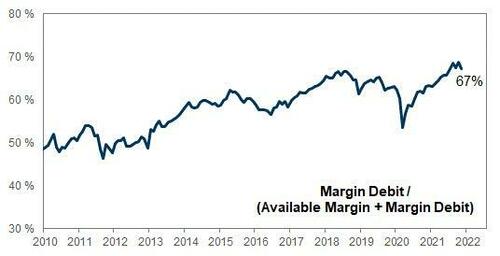
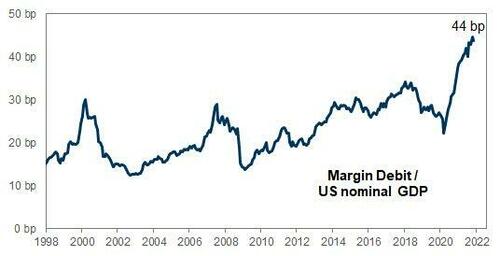
4. Leverage is elevated and this has limited any form of buying the dip (BTD).
* * *
Bucket 3: Systematic and Technical Selling: Impact at market directional short selling (mostly the open and mostly the close).
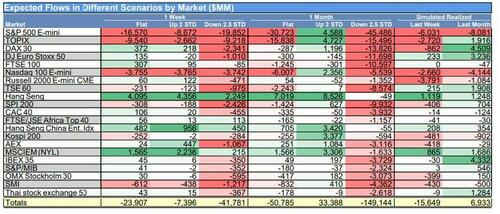
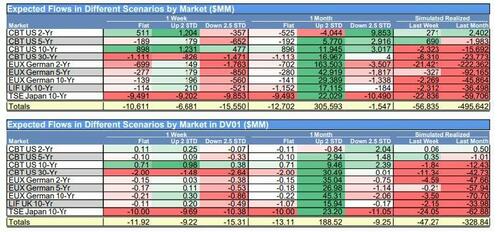
5. Systematic Equity CTA medium levels Triggered for the first time since March 2020
Over the next 1 week:
- flat tape ... -24bn to sell (70% of this is SPX)
- up tape ... -7bn to sell
- down tape ... -42bn to sell (50% of this is SPX)
Over the 1 month:
- flat tape ... -51bn to sell
- up tape ... +33bn to buy
- down tape ... -150bn to sell
CTA for fixed income is NOW very asymmetric to the buy side. Look at the simulations for “up big” vs “down big” over the next 1-month. In a down tape, not much left to sell.
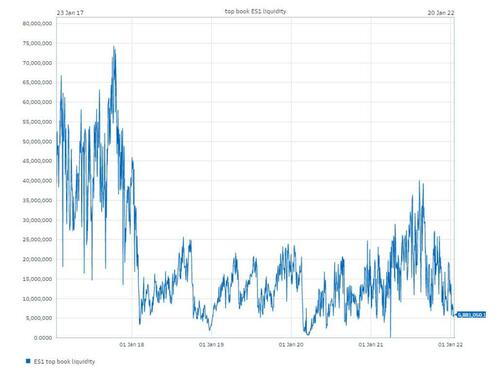
6. Liquidation Flows - Liquidity in the most liquid equity future in the world has been challenged. Liquidity on the screens is ~$5M, near the 5-yr lows.
* * *
Bucket 4: Corporate Blackout Window (ends today): No vwap style buying of the dips
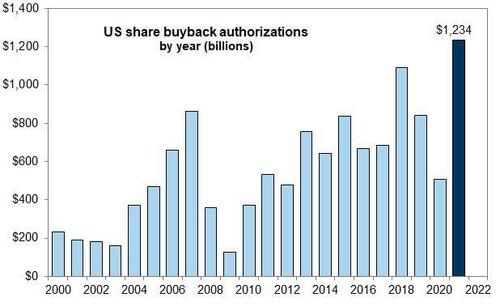
7. US Corporates the largest purchaser of stocks in 2021 has been out of the market for 2022 (some small activity in 5b29-1 plans) and starts again on Monday with lower prices.
Corporates return to the market on Monday (1/24/22) for the first time in 2022 with the nimble ability to now buy into weakness. According to Goldman, US corporates are the largest buyer of the equity market in 2022, with +$975 Billion of demand, the best year on record. This is roughly $245B per quarter (next blackout is March 14th). ~$245B / 45 days blackout adjusted. This is $5.5B per day during this stretch. 8% of the S&P is currently in the open window. This matters for the index level, as much as not being in the market, also mattered.
* * *
Bucket 5: Negative Institutional Sentiment: Impact intra manager hedging fundamental long positions through ETFs and Futures (think ARKK). This is mostly spot dependent throughout the day.
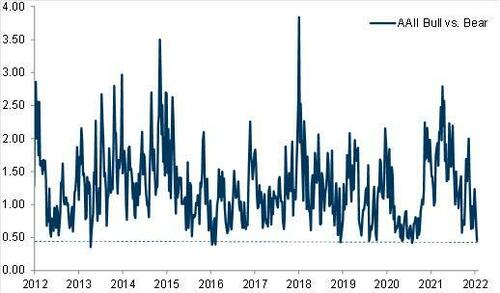
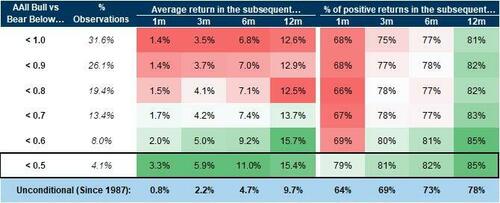
8. Sentiment is the lowest in 10 years. Backtest has typically been a contrarian indicator.
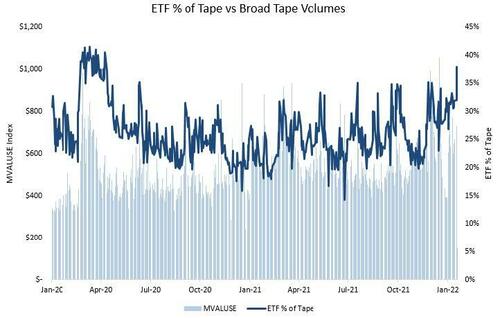
9. Macro de-risking through ETF’s and Futures. For example, ETF volumes represent 38% of the market volumes. ETF shorts vs. single names longs are large.
10. Liquidation style Bid-wanted institutional orders, etc. Blocks have been busy.
Bucket 6: Short Gamma. Dealer hedging todays expiry has exacerbated market moves: Impact Shorting the intraday lows, this was seen yesterday, given today’s AM expiry
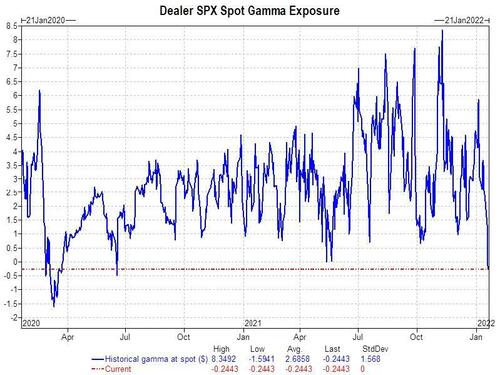
11. Dealers are short index gamma for the first time since March 2020. Dealers got short gamma quickly
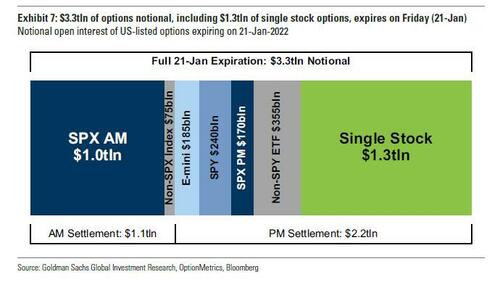
12. Option Expiry (Op-Ex) was Friday and $3.4 Trillion worth of options expire. A large portion of deal short gamma rolls off by the close of business today.
- i) for index, Goldman has ~$1.2tr of SPX expiring (19% of total OI) and $239bn of SPY (31% of total OI)
- ii) with $1.28 trillion (~40% of total open interest) option notional expiring on the bell … The second largest single stock expiry of all-time.
* * *
Bucket 7: Things that Goldman is watching for next week: Impact vwap style, buffer, less directional.
13. Money Markets saw outflows of -$84B this week. This is the largest ever money market redemption (going back to 2007). Now in the trading accounts?
14. Month-End Pension Demand is expected to be a small positive, but net buy demand for equities (+$8B).
- GS US PENSION REBAL ESTIMATES: As of yday's close, the GS model estimates $8bn of US equities to BUY for month-end. This ranks in the 22nd %ile over the past 3yrs ($25bn 3y avg).
Monthly Performance:
- S&P Total Return -5.89%
- 10yr Total Return -2.62%
15. Future Short Cover Potential “at some point” in the future (tbd).
Goldman's Bottom Line: Not all clear, but next week, later in the week, the conditions for a rally will improve.
The full Goldman note is available to professional ZH subscribers.
https://ift.tt/3rJbB9B
from ZeroHedge News https://ift.tt/3rJbB9B
via IFTTT




0 comments
Post a Comment