2008 vs 2020: Better, Worse Or Unknown?
Now that almost a month has passed since a meteor (metaphorically... for now) slammed the US stock market, unleashing the fastest bear and bull markets in history, a global economy that has ground to a halt as over 2 billion people now live under lockdown conditions, and an unprecedented response that includes $7 trillion in monetary and $5 trillion in fiscal stimulus (and counting), which will explode the US budget deficit to at least $2.4 trillion in 2020...
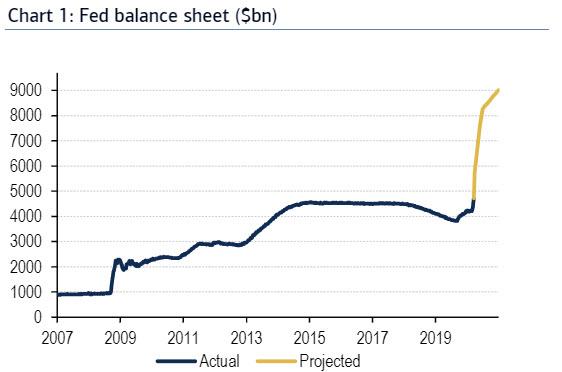
... and double the Fed's balance sheet in the next 9 months to $9 trillion...
... it is allowing analysts to present a more nuanced take on if not where we are headed, then where we have been.
One such take was performed by BMO's FICC strategist Daniel Krieter who looked at the recent move in fixed income markets and credit spreads to determine if the current crisis is better, worse or in line with the global financial crisis of 2008.
Comparing the current crisis to his previous assessment of the US economy in 2020 that framed the backbone of his full year outlook, Krieter writes that rather than a modest drop, consumer spending is likely to reach all-time lows in short order and bring about a far more severe recession than he was originally projecting. Therefore, spreads moving wider than any non-crisis period on record makes sense. But do the peaks of 2008/09 represent fair targets for the peaks in credit spreads this time around? To answer this question, the BMO analyst looks at a few factors to determine if the increasingly common comparisons between the current economic downturn and the global financial crisis are justified.
Household vulnerability: Figure 4 shows the ratio of household debt service expense to total disposable income reached a 40-year peak in 2008, just ahead of the financial crisis. In the current cycle, the consumer is in much better shape according to this and other metrics of consumer leverage. We simply display debt service expense to total disposable income because of superior historical data availability. Despite increasing concerns of rising non-mortgage debt on consumer balance sheets, the consumer appears far more able to handle an economic downturn now than during 2008. Comparison: Better than 2008
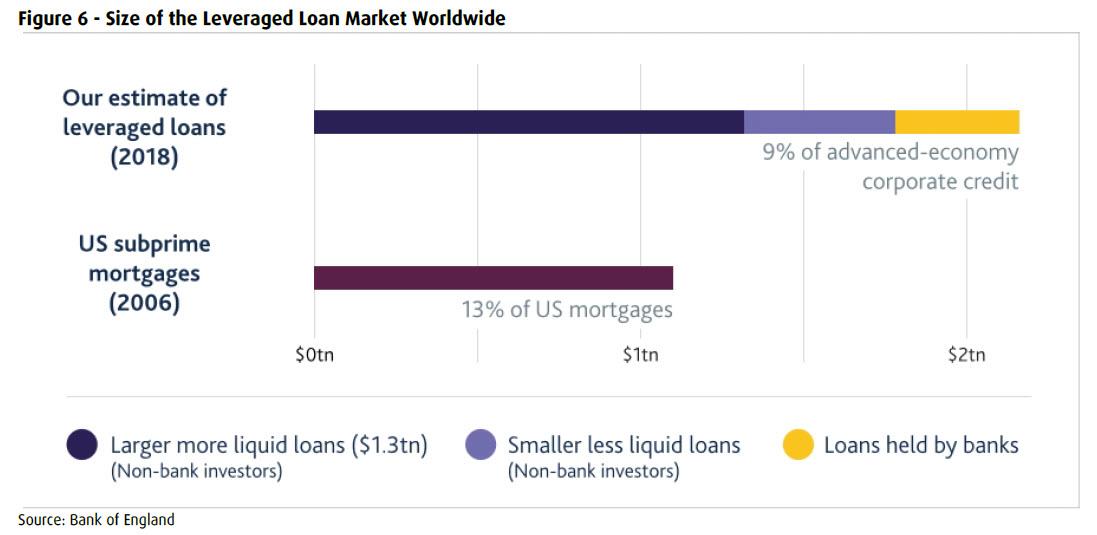
Business vulnerability: The same cannot be said for the business sector. Figure 5 shows leverage in the business sector currently sits near all-time highs, well in excess of the previous peaks realized during the 2001 cycle. (There is an extended discussion of the business sector in more detail below). Comparison: Worse than 2008
Consumer confidence/spending: BMO breaks this important factor down into three sub-categories.
Wealth effect: In 2008, the stock market sold off more than 55% with a drastic impact on savings, particularly retirement saving. In addition, the housing market fell precipitously, causing many people to either lose their home or go underwater on their mortgages. This phenomenon was not limited to just the bad borrowers that turned in their keys. Good borrowers who simply bought their house at the wrong time lost a significant portion of the equity in their house and, in many cases, all of it. The massive hit to wealth is what slowed down consumer spending and brought on recession. The housing market will not repeat its decline this time around, even if a slow spring moving season will very likely be reflected in housing prices. Still, the expected temporary nature of the virus means that housing prices are extremely unlikely to experience drops similar to the financial crisis. In addition, the stock market was down as much as 30% since reaching all-time highs on February 20th. Though downward momentum remains, the hit to 401k is nowhere near as drastic as the 2008 experience (at least so far). Comparison: Better than 2008
Exogenous shock: Naturally, there were many ingredients in the 2008 recession, but if one event were to meet the definition of "catalyst" it would without doubt be the failure of Lehman Brothers in September 2008. Lehman's collapse set in motion the chain of events that led to the worst economic downturn since the Great Depression, but, in isolation, the Lehman collapse had very little impact on the economy. On the other hand, the economic consequences of self-quarantine brought on by COVID-19 are arguably the most difficult exogenous shock that financial markets have ever dealt with. Comparison: Worse than 2008
Unemployment: The official U3 unemployment rate peaked at 10% during the 2008 recession compared to today's unemployment rate of 3.5%. The loss of jobs during the financial crises was the second most severe in the history of the data series. In this cycle, the severity of the projected drop in consumer spending as a result of quarantine is likely to send unemployment significantly higher, and there is concern that the unemployment rate could surpass 2008 levels in a worst case scenario. In fact, during a behind closed doors meeting with Congress during the past week, Treasury Secretary Mnuchin reportedly used estimates of unemployment as high as 20% unless Congress intervened with fiscal stimulus considering the outsized impact the virus has on the service sector and the disproportionally high number of service sector employees. Fortunately, a $2.2 tn dollar stimulus package has passed. Nevertheless, unemployment is going to rise, the only question is how much. Consider the loans being made available to small business through stimulus. As currently proposed, the loans stipulate that employees must be kept on payroll for the next six weeks and the loan covers wages paid. The cash doesn't help with anything else, it just covers the wages of employees that you are now required to keep employed. Following the six-week period, the small business must then pay all of its employees and a new loan out of future earnings. This means that stimulus loans have very little or no benefit for companies that won't realize significant pent-up demand once the virus is contained. For these companies, a more appealing option may be to simply reduce headcount now and try to weather the storm until demand comes back. Next, consider that the majority of employees in the United States work for companies with more than 500 employees and are thus ineligible for small business loans (even if some work in distressed sectors that will receive stimulus funds). The coming fiscal package likely ensures that unemployment won't reach the worst case scenario projected by Secretary Mnuchin, but an increase to 2008 levels is likely well within in reach. In a worst case scenario where the virus lingers longer than currently expected, unemployment could easily surpass the highs of the financial crisis. Comparison: Unknown.
Government/Central Bank Response: In response to the current economic downturn, the Fed and U.S. government have already deployed essentially the same relief package that was deployed in response to the 2008 financial crisis. The Fed has slashed rates to zero and committed to unlimited QE. In addition, the central bank has deployed a number of non-traditional monetary policy tools to help aid the functioning of financial markets through this difficult time. These tools designed to boost liquidity are very similar to the "alphabet soup" facilities deployed during the financial crisis. For its part, the government has enacted a $2.2 tn stimulus package, very similar in terms of financial commitment to the ARRA act of 2009. As part of the stimulus, most Americans will get checks of at least $1,200 dollars in April and May to help smooth the fall in consumer spending. In 2008, Americans got a check for $600, followed by a tax credit of $400 in 2009 for a total fiscal stimulus of $1,000. Importantly, this is just the extent of measures deployed so far. Further stimulus in the form of delayed mortgage payments are on the table, and have already been deployed in certain circumstances alongside a 60-day suspension in student loan payments. The Fed is also buying corporate bonds for the first time. Comparison: Better than 2008
Timing of government/central bank response: In 2008, it took months for rates to reach to the effective lower bound, enact QE, and for large scale fiscal stimulus to be deployed. In 2020, this process took just weeks. Comparison: Better than 2008
GDP: The reality that the U.S. is now in recession has officially taken root, and evidence of that is beginning to show up in economic projections. Updated economist expectations for Q1 GDP range from -4% to 1%, while Q2 projections are looking very dire. In fact, economists are expecting the second quarter to potentially be the worst quarter of GDP growth since at least the Great Depression, with estimates as low as -24%. If realized, these estimates suggest GDP growth of -2.5% for 2020, which is likely a good starting point for a base case. By comparison, the worst annual GDP growth realized during the financial crisis came during the four quarters ending June 2009 at -3.9%. Unfortunately, estimates of the COVID-19 impact on GDP continue to worsen, exemplified by a projection of -24% annualized GDP contraction in Q2 from Goldman Sachs. If second quarter GDP actually turns out that bad, GDP contraction in 2020 could easily rival or surpass 2008. In addition, most economists currently project a swift rebound in the third and fourth quarters, presumably once virus concerns fade with the arrival of higher temperatures in summer. But what if summer fails to stem the spread of the virus? Or even if it does, what if virus fears return during the fourth quarter with temperatures dropping again and no vaccine in place? In this case, any growth in the third quarter is unlikely to be sustained in the fourth quarter with the return of quarantine fears. Comparison: Unknown.
In conclusion, Krieter writes that after analyzing a variety of factors in both the current environment and the financial crisis of 2008, comparisons between the two are indeed justified. A few factors suggest that the current recession may not be as bad as the financial crisis, chief among these the strength and timing of government/central bank intervention. On the other hand, there are other factors to suggest that the current downturn will be just as bad as the financial crisis, and potentially worse. Much remains uncertain and dependent upon the path of the virus. In a worst case scenario where virus spread and ensuing quarantine lasts longer than the market currently expects, some of the factors discussed above that we determined were better than or similar to 2008 could easily flip to being worse (unemployment, contagion, and GDP). In this case, the current economic downturn is likely to be worse than the financial crisis. There is no potential for the factors determined to be worse than 2008 to flip to being better.
https://ift.tt/2UMmjf3
from ZeroHedge News https://ift.tt/2UMmjf3
via IFTTT


0 comments
Post a Comment