Life Expectancy In 2020 Fell 2.3% To 77 Years. Does This Justify The COVID Panic?
Authored by Ryan McMaken via The Mises Institute,
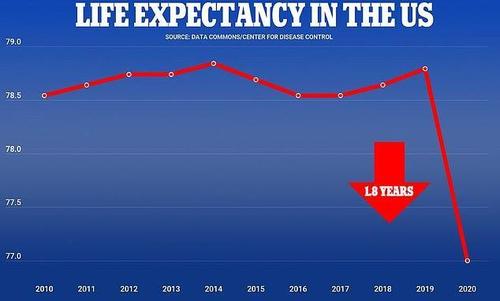
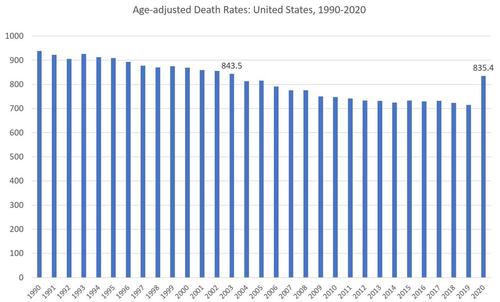
According to a new report released Wednesday by the Centers for Disease Control, the life expectancy at birth in the United States fell to 77.0 years in 2020, falling from 2019’s life expectancy of 78.8 years. The report also noted an increase of mortality with age-adjusted mortality in the US rising from 715.2 per 100,000 in 2019 to 836.4 per 100,000 in 2020.
Media reporting on the CDC’s report provide a variety of statistics on one-year percentage changes, no doubt with an eye toward maximizing the perceived effect of covid-19 on American health. But what are the trends when we look at these numbers in the larger context? That is, just how much has life expectancy and mortality swung from what we’ve experienced in recent decades? A closer look at these numbers suggests that covid does not exactly represent an epochal change in life expectancy, health, or healthcare.
Moreover, the new numbers also help illustrate how efforts by journalists earlier this year to describe covid-19 as "deadlier" than the 1918 flu were wildly off the mark.
Just How Much Did Life Expectancy Fall in 2020?
When the CDC released preliminary numbers on 2020’s life expectancy earlier this year, many sources claimed life expectancy "fell off a cliff." This week the tradition continued with The Daily Mail, for example, publishing this graph with a curiously truncated y axis:
If we take a longer historical view of life expectancy figures—with a normal y axis—things look a little different:
Source: Historical data through 2018 obtained from National Center for Health Statistics Data Visualization Gallery (Mortality Trends in the United States, 1900–2018). Age-adjusted death rates for 2019 and 2020 obtained from Sherry L. Murphy, B.S., Kenneth D. Kochanek, M.A., Jiaquan Xu, M.D., and Elizabeth Arias, Ph.D., Mortality in the United States, 2020, NCHS Data Brief No. 427, (December 2021)
In 2020, life expectancy fell from 78.8 years in 2019 to 77 years in 2020. That's a drop of 2.3 percent. However, we also find that 2020’s life expectancy of 77 years was equal to that of 2001, a period not exactly of the distant past before penicillin. Nor were the gains between 2001 and 2020 particularly impressive. Life expectancy in the US didn’t budge more than one-tenth of a year between 2010 and 2019, going back and forth between 78.7 and 78.8. This means from 2001 to 2010, life expectancy increased only 2.2 percent. (Compare, for example, with the increase from 1971 to 1980 when life expectancy increased by 3.6 percent). In other words, it didn't take much for life expectancy to return to a level from 20-years prior. The past twenty years has not exactly been a period of great progress in this regard.
A historical view also reveals that recent and ongoing attempts to compare the covid-19 pandemic to the flu epidemic of 1918 are hardly appropriate. From 1917 to 1918, life expectancy is estimated to have fallen by an enormous 23 percent, falling from 50.9 to 39.1.
Source: Historical data through 2018 obtained from National Center for Health Statistics Data Visualization Gallery (Mortality Trends in the United States, 1900–2018). Age-adjusted death rates for 2019 and 2020 obtained from Sherry L. Murphy, B.S., Kenneth D. Kochanek, M.A., Jiaquan Xu, M.D., and Elizabeth Arias, Ph.D., Mortality in the United States, 2020, NCHS Data Brief No. 427, (December 2021)
(The case of 1918 does provide a helpful reminder, however, that epidemics do not necessarily signal a departure from larger trends. By 1919, the life expectancy in the US had rebounded with the measure increasing to a new high of 60.8 in 1921.)
Changes in Age-Adjusted Mortality
The CDC on Wednesday also released new finalized year-end numbers for mortality in 2020. From this data we see changes in life expectancy and mortality were driven overwhelmingly by deaths among adults. As the new report shows, mortality from 2019 to 2020 was virtually unchanged in the under-15 population, and for children under 5, mortality actually declined.
More important still is age-adjusted mortality. This shows us changes in mortality while taking into account the fact that the population is aging overall—and thus more likely to experience disease and death than is a younger population. From 2019 to 2020, age-adjusted mortality in the US rose from 715.2 per 100,000 to 836.4 per 100,000. That's an increase of nearly 17 percent. Yet, again, the rise should hardly be panic-inducing. This rise brings age-adjusted mortality back to 2003 levels—a period not exactly in the distant past.
Source: Historical data through 2018 obtained from National Center for Health Statistics Data Visualization Gallery (Mortality Trends in the United States, 1900–2018). Age-adjusted death rates for 2019 and 2020 obtained from Sherry L. Murphy, B.S., Kenneth D. Kochanek, M.A., Jiaquan Xu, M.D., and Elizabeth Arias, Ph.D., Mortality in the United States, 2020, NCHS Data Brief No. 427, (December 2021)
A larger historical view also shows that recent efforts to compare covid to the 1918 flu in terms of mortality wildly overstate the impact of the current situation. From 1917 to 1918, the age-adjusted mortality rate increased by 392 per 100,000. From 2019 to 2020, the increase was 120 per 100,000.
Source: Historical data through 2018 obtained from National Center for Health Statistics Data Visualization Gallery (Mortality Trends in the United States, 1900–2018). Age-adjusted death rates for 2019 and 2020 obtained from Sherry L. Murphy, B.S., Kenneth D. Kochanek, M.A., Jiaquan Xu, M.D., and Elizabeth Arias, Ph.D., Mortality in the United States, 2020, NCHS Data Brief No. 427, (December 2021)
The point here, of course, is not that covid deaths over the past eighteen months are insignificant. Indeed, even if we make no distinction between covid deaths and noncovid deaths since early 2020, it’s clear more Americans have indeed been dying from all causes. And that’s hardly something to celebrate or ignore. Moreover, the CDC’s report is an unpleasant reminder that life expectancy in the US had already all but screeched to a halt in the decade leading up to 2020. This was likely due to a continued and rapid rise in obesity—rising nearly 40 percent from 2000 to 2018—which has in turn fueled both heart disease and diabetes. Both these conditions are factors known to substantially increase the severity of covid-19.
Nevertheless, it remains important to obtain some much-needed context when examining a disease which is being used to justify unprecedented increases in state power over even the most basic personal and economic activities of ordinary people. Even considering recent data on life expectancy and mortality, it remains extremely unclear why 2020’s changes in these metrics would justify the extreme panic and human rights violations that resulted from stay-at-home edicts and coerced medication.
American citizens are nowadays subjected to a nonstop drumbeat of claims about "unprecedented" levels of mortality. We’re even told covid is just like the flu of 1918. And to what end? Apparently, to rob people of their livelihoods if they refuse to receive a vaccine. It’s to attempt to make pariahs of anyone who makes health decisions of which the regime does not approve. It’s to continue to justify 2020’s ineffectual lockdowns. It’s to justify government spending at levels unprecedented in peacetime. It’s to deny that natural immunity provides meaningful resistance to the disease. Yet all this rhetoric occurs at a time when age-adjusted mortality and life expectancy is not exactly "off the charts" if we look beyond the confines of just the last few years.
https://ift.tt/3svEPe1
from ZeroHedge News https://ift.tt/3svEPe1
via IFTTT


0 comments
Post a Comment