After The Market's Week From Hell, Here's A List Of Who Was Puking
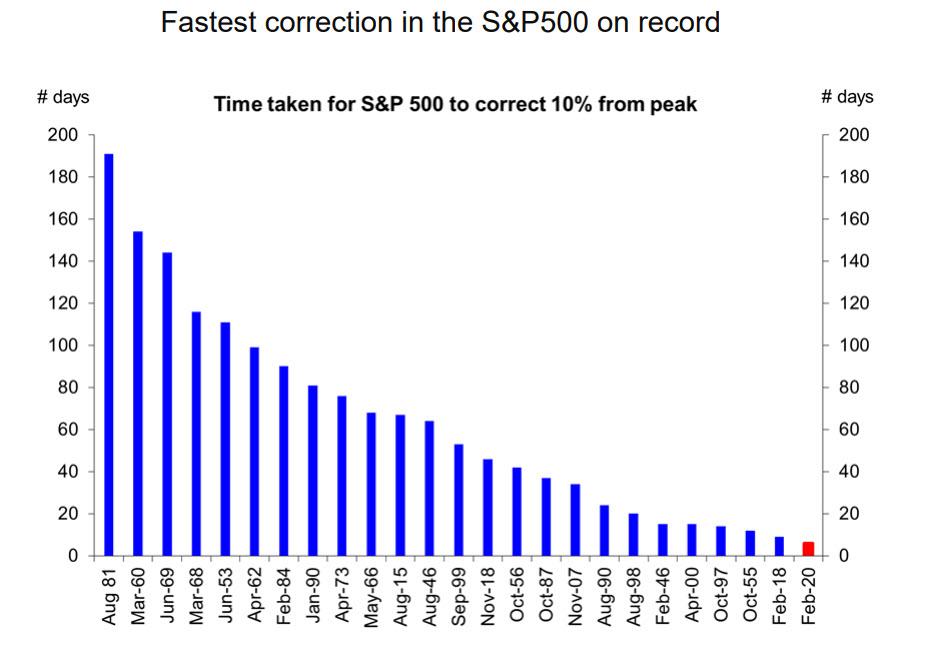
Over the past 7 days, which came just after the stock market hit an all time high, and which turned out to be the worst week for the S&P since the vomit-inducing days of the 2008 financial crisis, and also saw the fastest 10% correction from a market peak on record...
... we tried to put together the pieces of the "liquidation puzzle" to find out i) just who is selling, whether machines or people or some combination of both, and ii) is there more selling to go?
Of course, as we now know, the answer to ii) was "oh yes" as an entire generation of traders who had never seen a violent market crash recoiled in terror at the relentless selling, which sent the Dow more than 3% lower on 3 distinct occasions.
"A lot of us hadn’t seen this type of crash in our careers," admitted Justin Wilder, a 31-year-old research analyst at DRW Holdings LLC in Montreal who has never experienced an actual bear market in his career. "There’s definitely some nervousness on the floor, both for the trading and our health" added Justin who was still in high school when Lehman filed for bankruptcy and the S&P lost more than half of its value before the Fed stepped in with QE... and the rest is history.
Other Millennials were just as incredulous: "With coronavirus, the market has found a reason to correct in a way that I’d never seen before," Julian Carvajal, a 30-year-old FX trader at TCX Investment Management told Bloomberg.
"It’s been mental, and that’s probably an understatement," said Rishi Mishra, a 29-year-old research analyst at Futures First, who was definitely in high school when Lehman filed for bankruptcy. "Many of us who weren’t trading during the 2008 crisis see this as one of those days you could tell your grandchildren about." Well, Rishi, you may want to hold off on the grandchildren stories, especially if the Fed does not step in some 24 hours from now to prevent what may be a historic puke on Monday now that "community-spread" cases have emerged in the US, as well as the first coronavirus death.
But while we now know the answer to ii) what about i)? Courtesy of the latest weekly report from Deutsche Bank's flow expert Parag Thatte, we now know the answer to that too.
The answer to "who was selling" is, in short, everybody.
But before we get into the details, a quick reminder: we have been warning for the past two months that positioning and pricing in equities was extremely elevated, with most investors "all-in" in many cases with record leverage, and increasingly disconnected from growth indicators. And just in case any of the abovementioned millennial "traders" claim there were no signs a crash was imminent, well... there were,like the market being the most overbought and complacent ever, with every investor all-in as recently as last month:
... only to become even more overbought and even more complacent, with investors even more all-in...
... with record leverage and unprecedented "smart money" concentration in the same handful of stocks:
... and since nothing could dent the relentless Nasdaq ascent, even as Apple cut guidance due to the coronavirus...
... retail investors unleashed a never-before seen buying spree, and not just momentum stocks, but calls of momentum stocks...
... to the point where retail investors' record levered beta helped them outperform the entire hedge fund class!
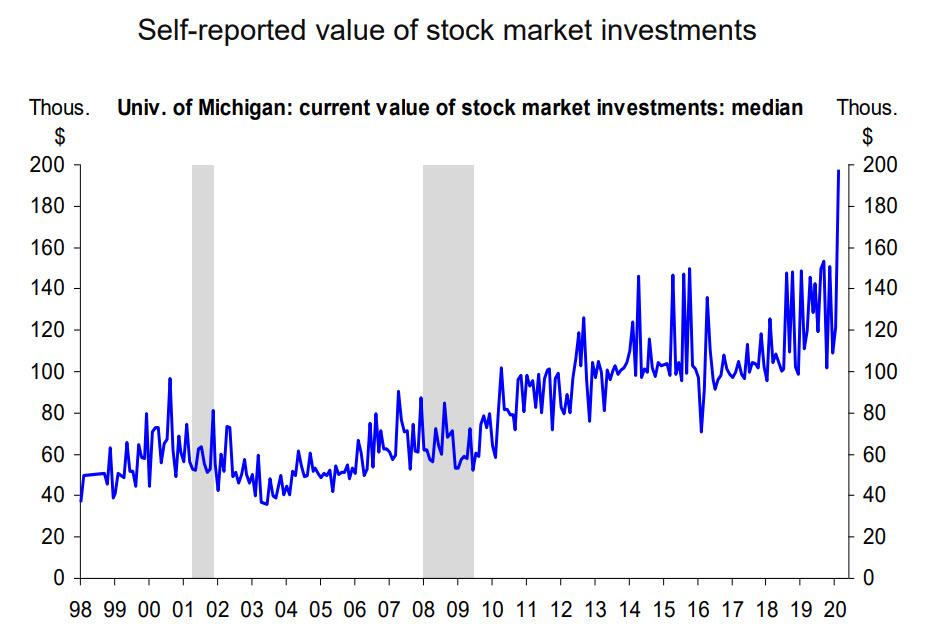
... and ushered in the "Profane, Greedy Traders of Reddit" who "Are Shaking Up the Stock Market" even as US consumers just reported the highest median current value of their market investments.
In short, everyone felt invincible, and all thanks to the Fed's QE4 which injected $600BN in the market and made even a modest drop appear impossible.
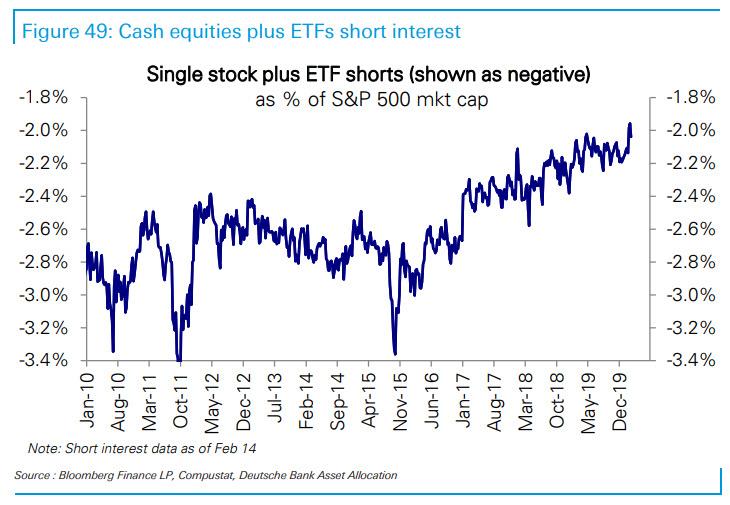
Only... it was not meant to last, and in a market that took the express elevator up and the Wile-E Coyote anvil down, especially with short interest at all time lows providing almost no natural buffer to a selloff (as there were almost no shorts covering into the plunge)...
... less than a week after markets hit an all time high, stocks crashed, suffering three 3%+ drops in the past week as algos suddenly realized that not even the Fed can print viral antibodies, resulting in the biggest one-day Dow Jones point drop on record (down 1,191 on "Viral Thursday"), but more importantly, the fastest 10% correction from an all-time Dow Jones high since just a few months before the start of the Great Depression.
* * *
Which brings us back to the original question: who was selling?
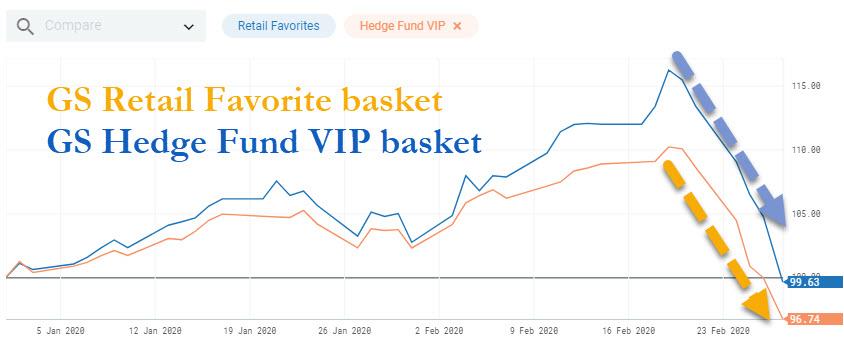
We already know that retail investors were steamrolled, with the Goldman Sachs Retail Favorite basket tumbling after returning more than 16% YTD just last week, and is now down for the year (curiously, it is still outperforming the GS Hedge Fund VIP basket which as of this morning is down more than 3% in 2020.)
What about non-retail investors?
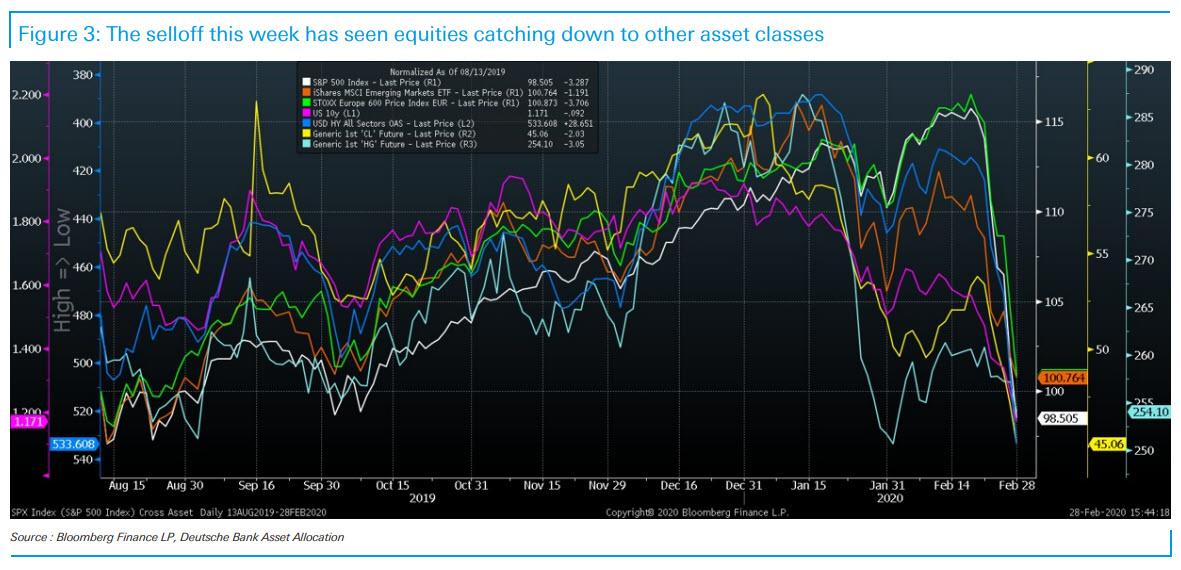
Oh, where to start with a historic selloff that has sent equities catching down to all other asset classes?
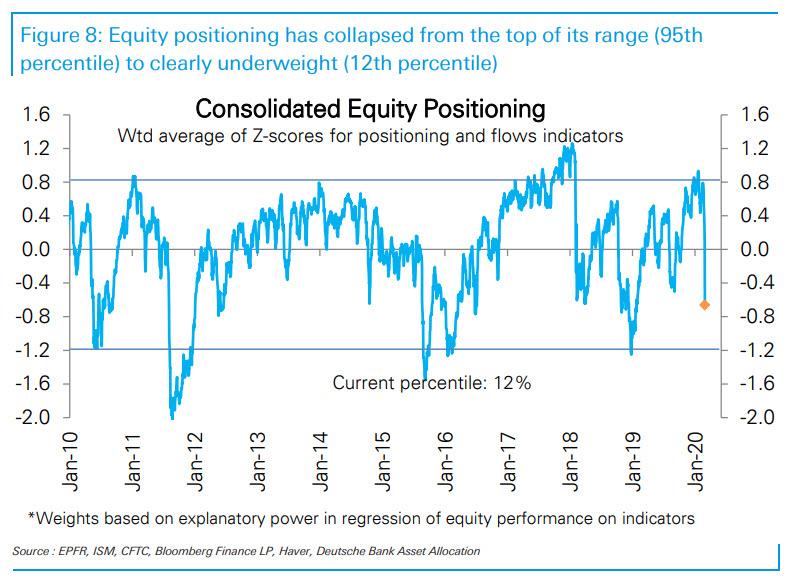
Well, how about at the top: as Thatte writes, equities positioning has flipped from being extremely overweight (95th percentile) to very underweight (12th percentile). DB's consolidated positioning metric, which was at the top of its historical range last week (95th percentile) has now fallen very sharply to underweight levels (12th percentile).
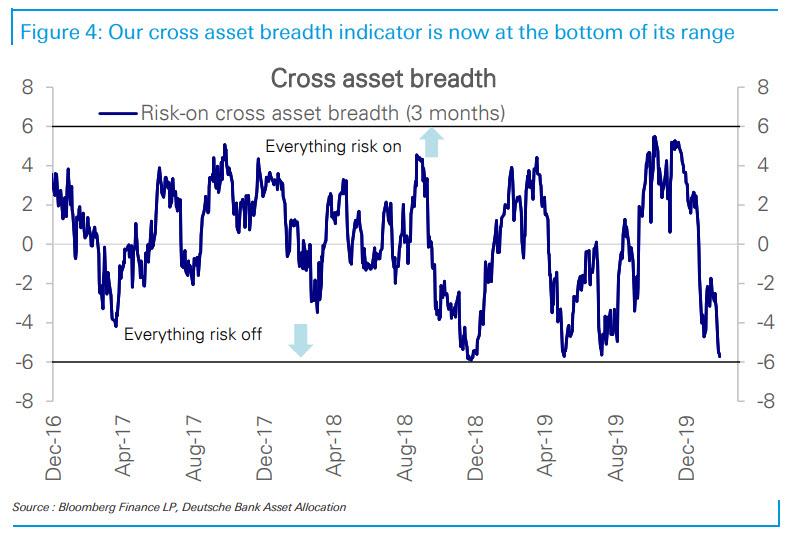
Meanwhile, the bank's cross asset breadth indicator has crashed from a near all time high, to what is basically an all time low.
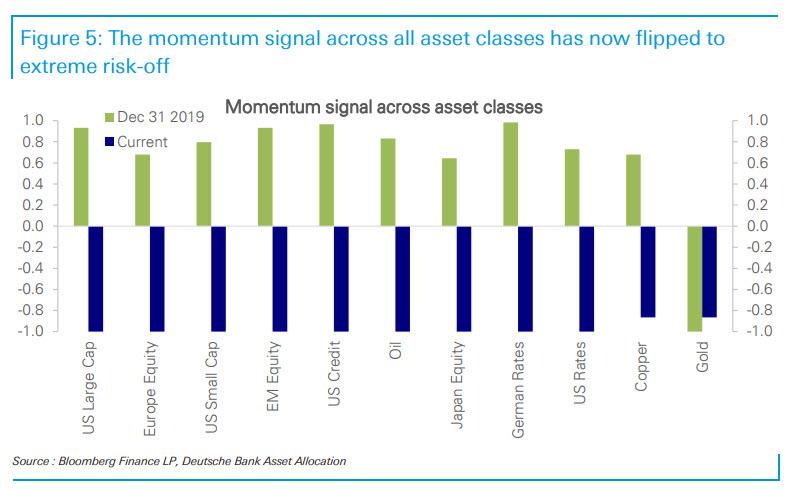
Worse, the true decline in positioning is likely bigger as some data is available only with a lag: as a result positioning is likely to decline further as momentum signals across all asset classes have now flipped to extreme, and in most cases record risk-off.
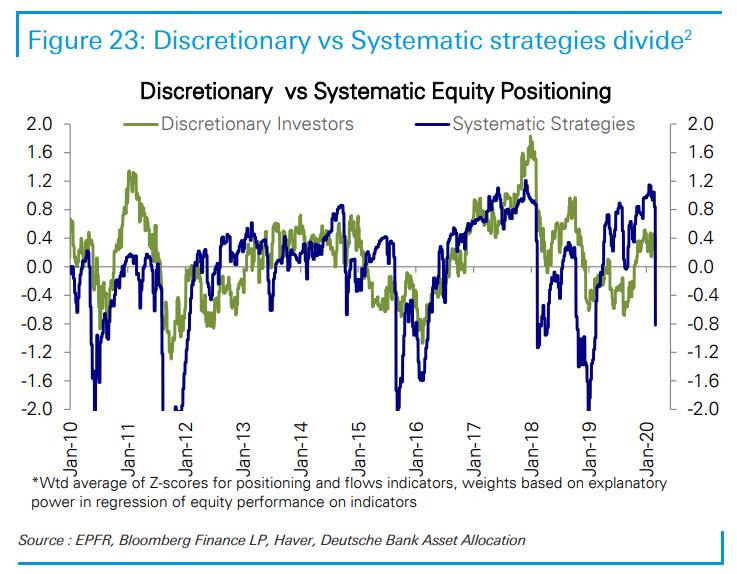
A more detailed breakdown of selling classes finds that while discretionary investors were indeed taken to the woodshed, it was systematic investors who were absolutely hammered.
Among them:
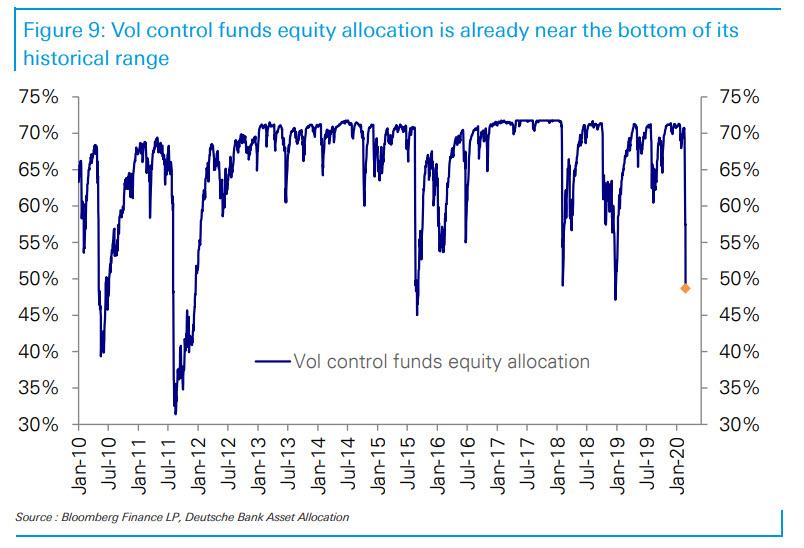
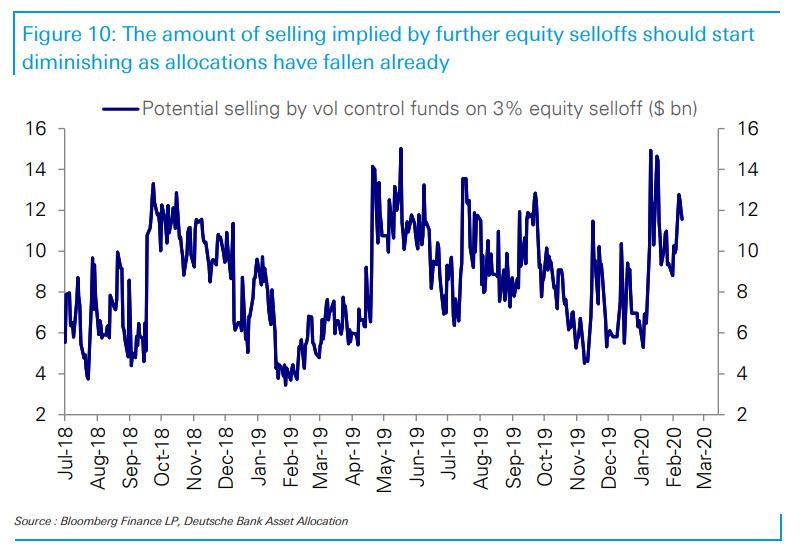
Vol control funds equity allocation is down sharply and their selling should start to diminish. Vol control funds have cut exposure to equities from historical maximum last week down to near the bottom of their range (5th percentile), selling $65bn of equities over the last one week.
They can still cut equity exposure further if vol rises but with allocations already low, their sensitivity to incremental selloffs should start to diminish.
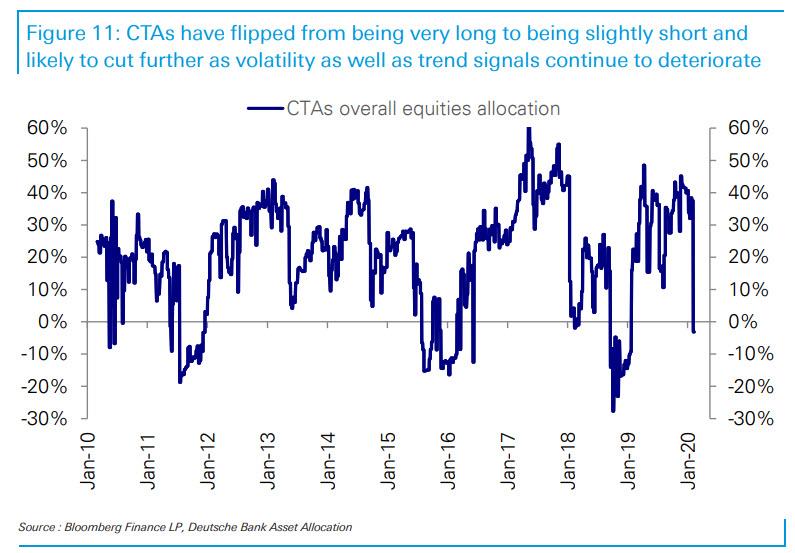
CTAs have cut equity exposure to being short but are likely to go further. CTAs were extremely long equities until last week and have now flipped to being slightly short (18th percentile) but their positioning remains above levels seen during prior large selloffs in 2011, 2016 and 2018. Volatility as well as trend signals continue to deteriorate and point to them raising their short positions further.
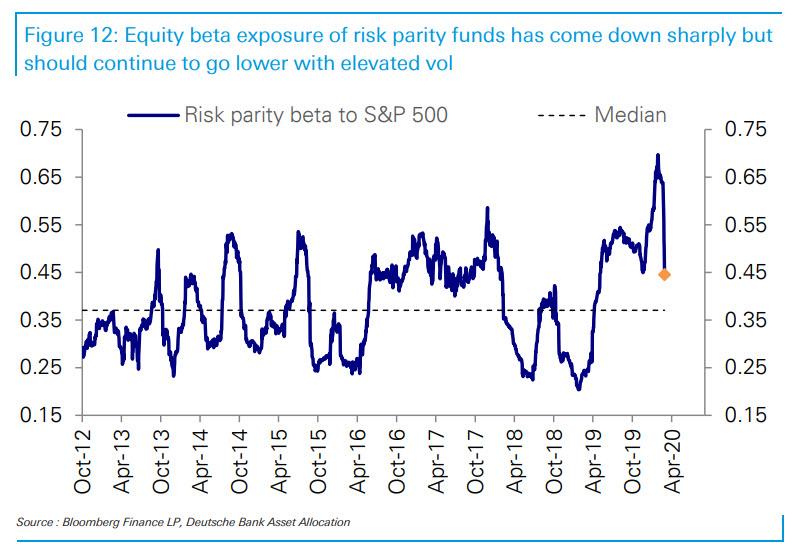
Risk parity funds’ equity exposure is down from a record high but remains elevated. Risk parity funds are likely to cut exposure further as volatility continues to remain elevated, but they tend to move more gradually compared to other systematic funds.
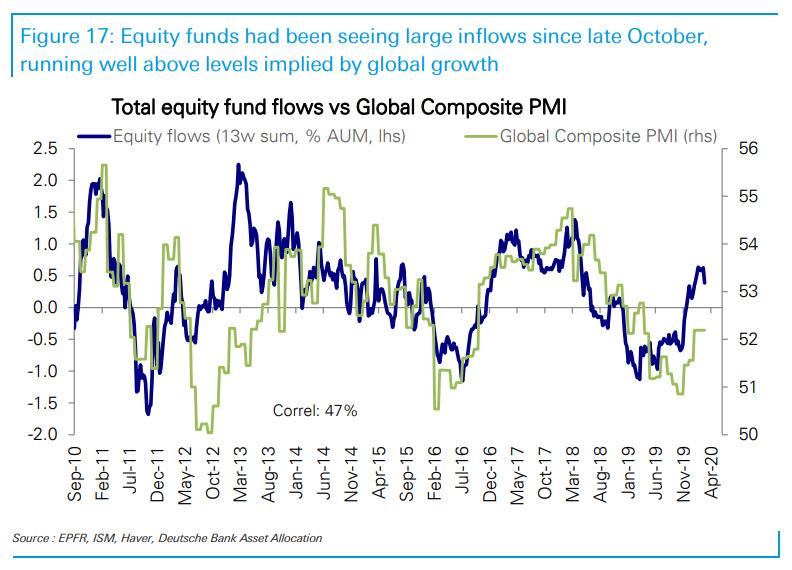
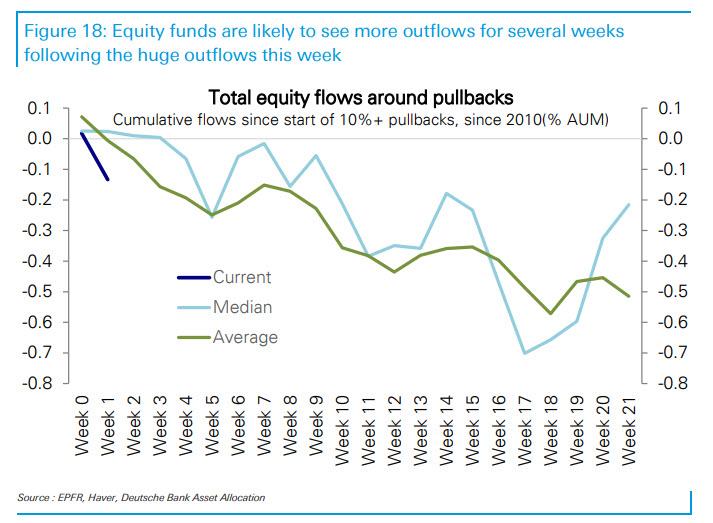
How about non-retail, non-systematic investors? Here too the selling was widespread, with huge outflows from equity funds this week but more to come. Equity funds have seen outflows of -$28bn since the selloff began last Friday. However, prior inflows since late October had been extremely strong...
... far more than implied by the modest rebound in global growth and we estimate that equity funds would need to see outflows of about -$130bn just to catch down.
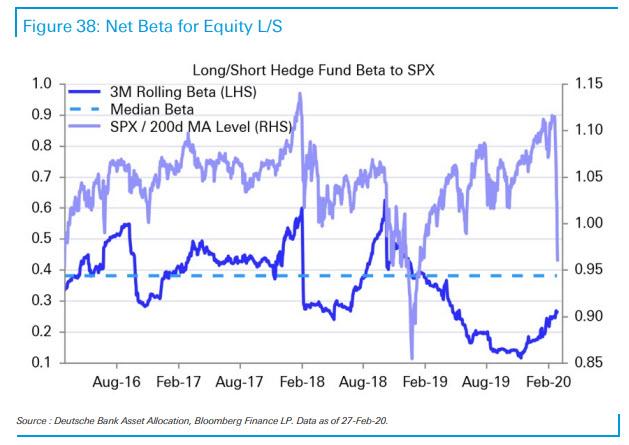
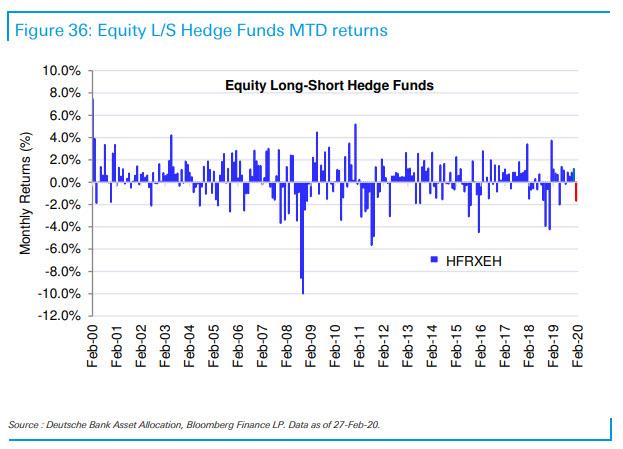
Hedge funds, which were perhaps the least euphoric investors into the February meltup thanks to their curiously low beta...
... suffered the least of all investors...
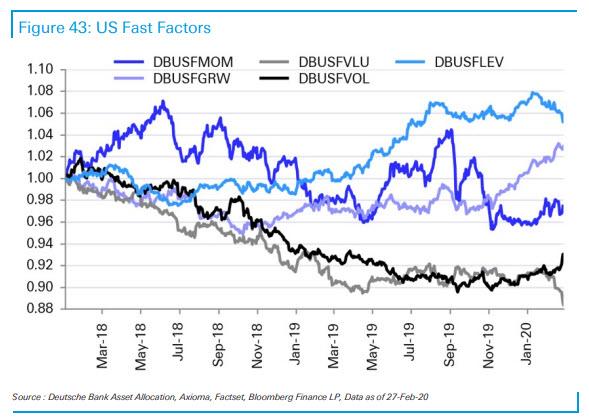
For quants, the pain was widespread, but nowhere more so than the contrarians with value funds cratering to new all time low.
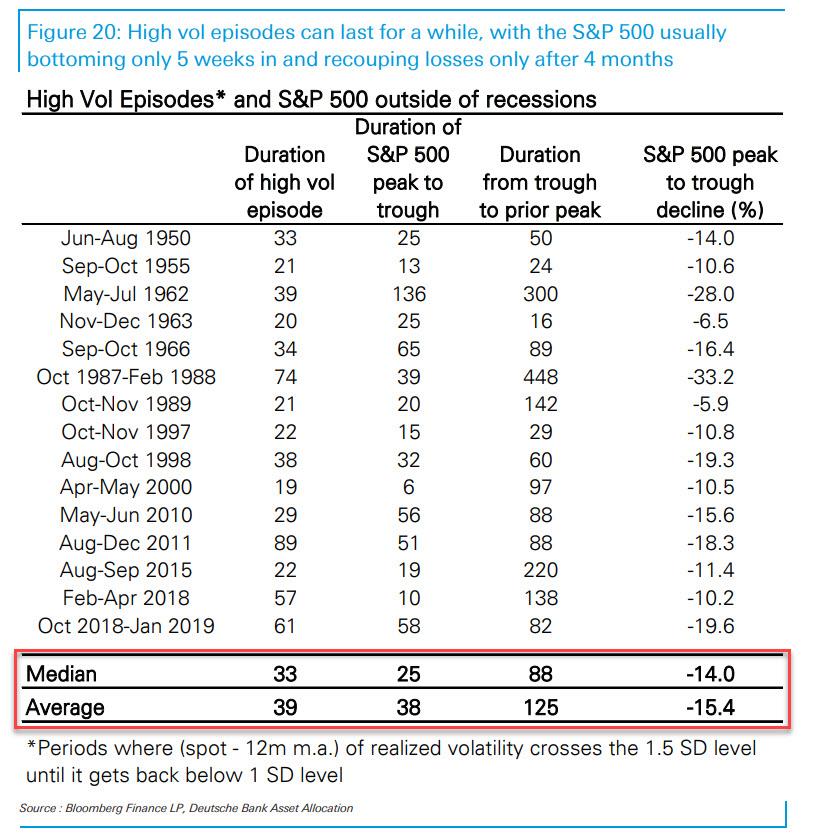
And here is the worst news for Buy-The-Fucking-Dippers: according to Thatte, "in past large selloffs, outflows typically continued for several weeks"... which means that this thing will go on for a long time.
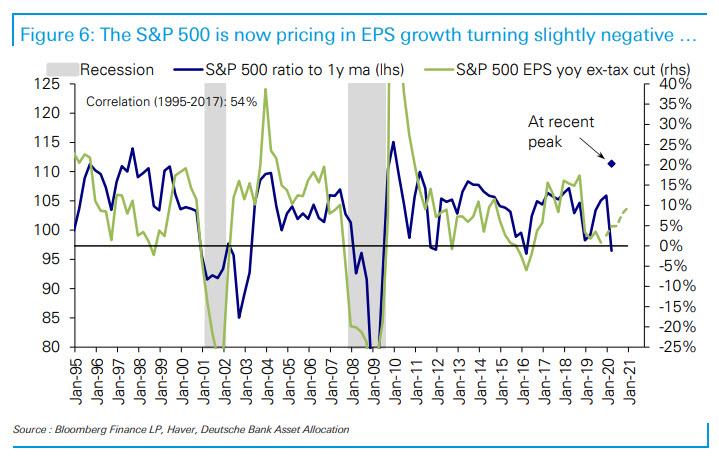
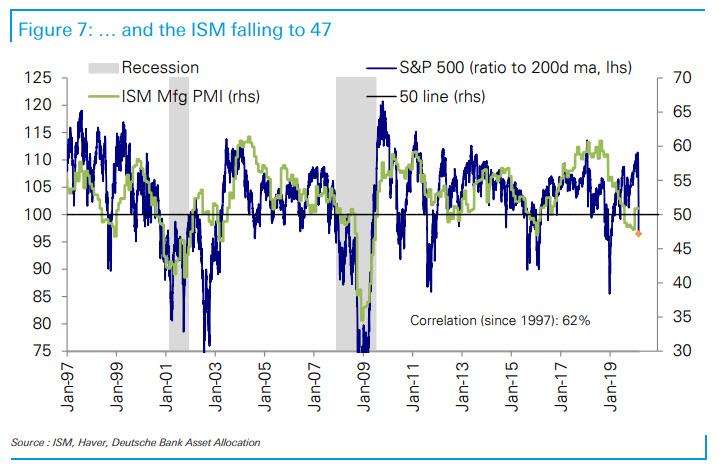
There was some good news: after last week's rout, stocks are finally realizing that there will be no earnings growth for the second consecutive year, and as a result the S&P is now pricing in negative EPS growth...
... and an ISM plunging to 47.
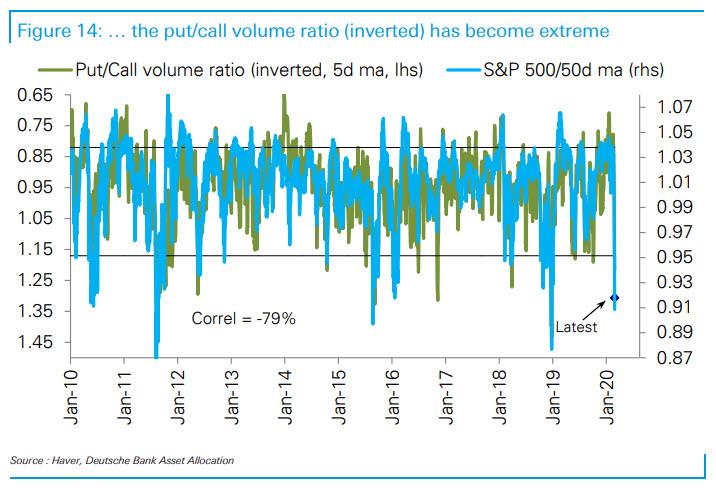
At the same time the put/call volume has reversed dramatically amid a surge in put buying which - at least from a contrarian standpoint - suggests that the market may finally be at a support level.
Putting this together, it means that unless it is now consensus that a global recession is coming - and as we discussed yesterday, one is certainly likely - the record sell-off may finally be poised to take a break.
https://ift.tt/2wl1UVC
from ZeroHedge News https://ift.tt/2wl1UVC
via IFTTT




0 comments
Post a Comment