One Bank Spots Powerful Selloff Trigger Hidden Within Historic Market Divergence
Remember when Zoltan Pozsar said one month ago that Powell has to crash the market in order to spark the recession he so desperately needs to finally contain inflation? He may not have long to wait according to the latest note from Bank of America's derivatives team...
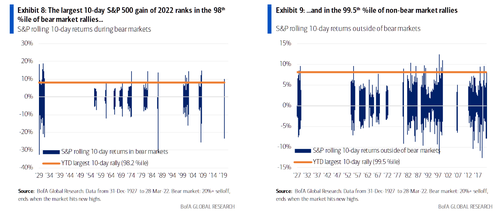
Bear markets produce the most vicious rallies - recall the relentless facerippers of Oct/Nov 2008 or March 2020 - and indeed, over the last two weeks, the S&P has produced one of its sharpest rallies in history. As shown below, the recent 10-day ramp ranks in the 98th %ile of bear market rallies and in the 99.5th %ile of non-bear market rallies
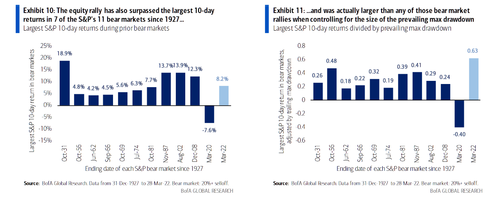
The recent rally has also surpassed the largest 10-day returns in 7 of the S&P’s 11 bear markets since 1927 and was actually larger than any of those bear market rallies when controlling for the size of the prevailing max drawdown.
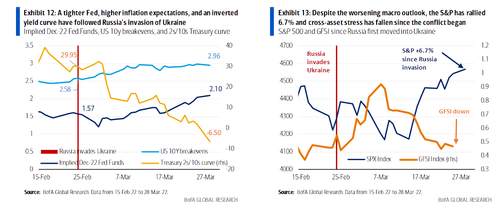
This historic bear market rally is "Not explained by fundamentals" according to BofA, and is taking place despite what the bank's derivatives strategists note is clearly weaker macro fundamentals (more hikes, higher inflation, and curve inversion) and the Fed leaning against equity market strength to hike faster (i.e., the birth of the short "Fed call", the opposite of the bullish Fed put).
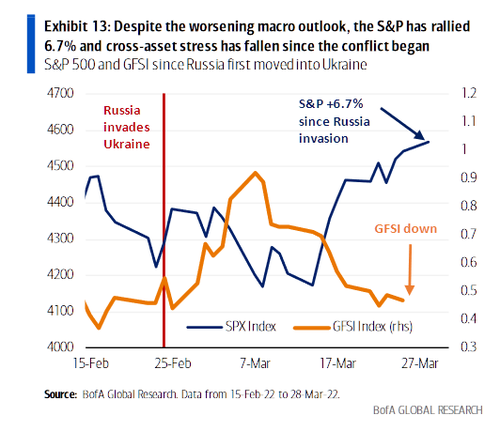
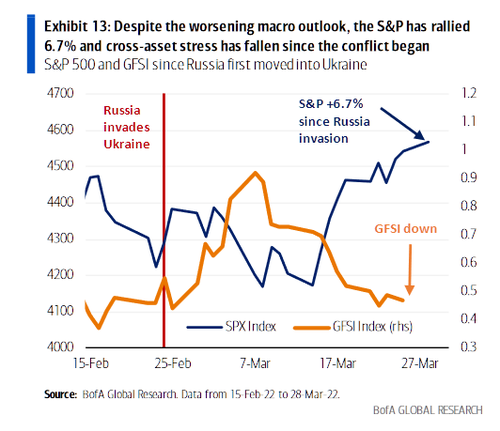
Some numbers: the rally has sent the S&P 6.7% above where it stood before Russia first moved into Ukraine on 24-Feb, bringing the bank's measure of cross- asset stress down in tandem.
During the same time:
- The Fed funds rate priced in for Dec-2022 is up from 1.57% (6 hikes) to 2.10% (8 hikes)
- US 10yr inflation breakevens have risen from 2.58% to 2.96%
- The 2s/10s Treasury curve just inverted (and certainly by far more than it ever did pre-GFC)
- Investors thinking we are “late in the cycle” up from 48% to 60% in our March. Fund Manager Survey, and “global recession” jumped to 2nd biggest tail risk.
Instead, markets have been dragged higher on the back of yet another epic short squeeze, and an even more furious gamma squeeze as Nomura's Charlie McElligott explained earlier.
As one of Goldman's top traders noted over the weekend in a surprisingly bearish note, the light positioning and inflated earnings are not enough to sustain gains: Indeed, as BofA notes, some blame the rally on light equity positioning and a positive effect of inflation through higher earnings. On the latter, the experience of the 1970s suggests otherwise (S&P returned 1.6% ann. during the decade). At the same time, Bank of America's strategists note that the lack of equity positioning (evident in the bank's Bull & Bear signal enter a “Buy” territory and lack of vol convexity in the selloff), even if it helped this bounce, seems unlikely to sustain it against this challenging macro backdrop.
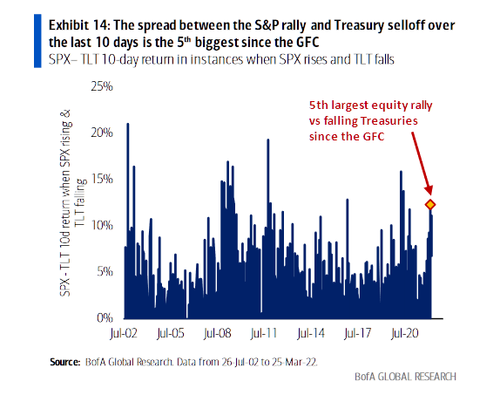
While stocks are whistling past the graveyard, rates markets a lot more stressed, and are pricing in a lot more risk than equities. As shown in the chart below, the spread between the S&P gain and Treasury selloff over the last 10 days is the 5th biggest since the GFC.
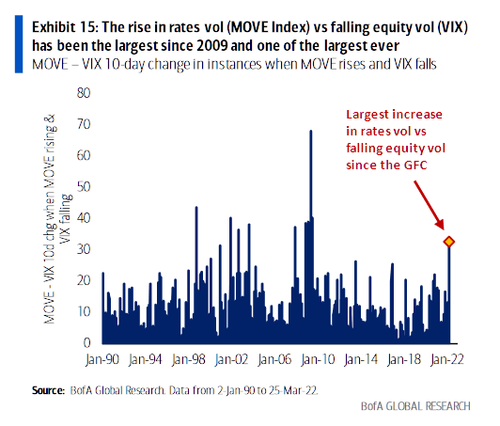
Even more stunning, the increase in rates vol (MOVE Index) relative to falling equity vol (VIX) has been the largest since 2009 and one of the largest ever.
What tends to follow? In the 2009 episode, the S&P fell 7% in the next 6 weeks in what was its first sizeable dip since the GFC low.
But wait there's more, because now that the “Fed put” has transitioned into a “Fed call”, any market upside is at best questionable: According to BofA, "investors should have by now stopped counting on the “Fed put” to come to the rescue. In fact, we think the Fed put has been for now replaced with a (short) “Fed call”.
What do we mean by this? The Fed is seeking tighter financial conditions to aid their fight against inflation, and in practice this means lower risk assets. Hence, they may hike faster on equity rallies, limiting the upside in stocks. Case in point: various financial conditions measures (and our GFSI index) have actually loosened since the Mar FOMC and triggered an avalanche of “50bp” comments from Fed speakers (see Global Rates Weekly)
As a counter to its bearish view, BofA notes that softer inflation is the only true, but unlikely upside risk: The arrival of the short “Fed call” suggests the key catalysts for sustained upside in US equities is one that, without harming growth, lowers the Fed’s need to quickly raise rates back to neutral. The most visible upside risk, therefore, is inflation softening on its own from here. And yet most economists see risks of inflation worsening on its own. Other upside catalysts that may only work in the short term are:
- Retail buying returns or earnings shine: but with the inflation backdrop unchanged, this allows the Fed to tighten further (and options data suggests extreme retail buying has not returned)
- Russia-Ukraine ceasefire: most positive near-term, falling commodities may be positive for equities (Exhibit 16), but lower geopolitical risk allows the Fed to hike faster (recall they pushed back against 50bps in March due to the conflict)
- Fixed income markets break before equities notice: the Fed is most sensitive to credit spreads and in theory could be forced to rescue credit before equities wake up to reality; however, this has never happened before, and it would only kick the can down the road if inflation doesn’t abate
How to trade this? In summary, for a moderate grind higher towards all-time highs, the bank likes buying S&P call ratios (buy 1, sell 2) in May, selling elevated implied vol and offering up to a 4.7-to-1 payout. To hedge downside risks, consider buying S&P June put spread collars, which cheapen the cost of the hedge by also selling away upside (this time above all-time highs) and offer close to a 10-to-1 max payout.
- To rent upside: with positioning still arguably light, the pain trade remains a grind higher. To participate in a continued grind higher for a low upfront cost and with limited downside risk, BofA likes buying call ratio overlays in SPX, benefitting from elevated implied vol. For instance, one can buy SPX May 4650/4800 1x2 call ratios (buy one & sell two calls) for 0.70% (4.7x max payout, ref. 4575.52). The short calls are struck at all-time highs.
- To hedge: the earlier points reinforce our preference for put spread collars as cheap protection, particularly when initiated on a rally as sharp as the S&P has just delivered. For instance, consider buying SPX Jun 4900/4400/3900 put spread collars for 1.1% (9.9x max payout, ref. 4575.52). The short call is struck 2% above all-time highs.
- Risks: beyond the upfront premium, the risk to both trades is a rally beyond the short call strike.
Much more in the full BofA note available to pro subs in the usual place.
https://ift.tt/lkQf82n
from ZeroHedge News https://ift.tt/lkQf82n
via IFTTT




0 comments
Post a Comment