Buyback Blackout Period Is Over, And 10 More Reasons Why Goldman Calls The End Of The Market Carnage
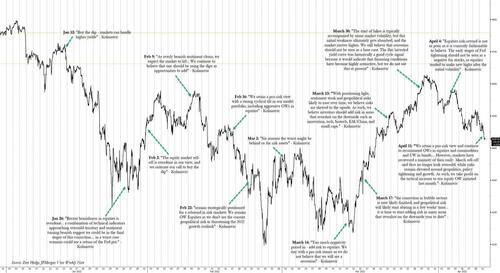
Two weeks ago, when looking at a recent matrix of market bull and bear cases, we asked if it was time to get bullish on stocks and concluded that the since fundamentals leaned in either direction, the answer was most likely “not yet” for one simple reason: JPM’s resident permabull, Marko Kolanovic, had just turned from modestly bearish – an extremely rare stance for him – to bullish again, urging his clients to reverse from taking profits (unclear on what exactly since he had been bullish all the way down from the market’s all time high)…
… to buying the dip again. Meanwhile, at roughly the same time, the far more accurate strategists at Goldman’s flow desk – in this case Tony Pasquariello - had just warned that the market was likely to be well lower in several weeks time, not higher. After last week’s furious rout in the market they were right.
Which is why we find it worth mentioning that after correctly calling the market’s downward inflection point in April, those same Goldman folks are once again leaning bullish, and in a Friday note from Goldman Scott Rubner (which is not for mass distribution to the bank’s entire client base and instead is reserved for a handful of the bank’s top client as it indicate what the bank’s traders actually do believe, it is also available to zero hedge professional subscribers), he says that the worst is behind us and gives 11 reasons why the late April rout may have been the market bottom for the time being.
Rubner’s argument in a nutshell: pointing to Thursday’s explosive move higher as testament of the market’s extremely negative sentiment and low positioning (which of course was followed by Friday’s rout), the Goldman trader thinks that global stocks will rally “significantly” in May as the flow-of-funds is set to improve starting on Monday (even though the closely watched 50bps rate hike FOMC meeting is due on May the 4th).
Below we lay out Rubner’s bullish 11-point checklist in greater detail.
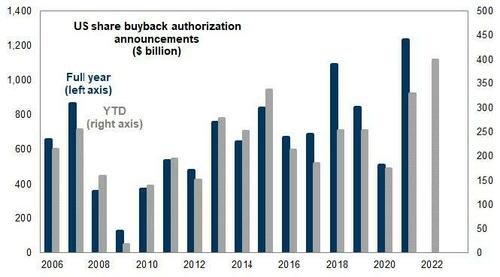
- 1. US Corporates return back to the open window on Monday with dry powder. Rubner calculates $5BN of demand per day, every day until mid-June. US corporates are the largest buyer of equities in 2022 and have authorized record YTD (AAPL = $90bn; GOOG = $70bn; MSFT = $60bn; FB = $50bn, etc).
- 2. Pensions flipped to buy given the recent outperformance of bonds vs stock. This should carry over into next week.
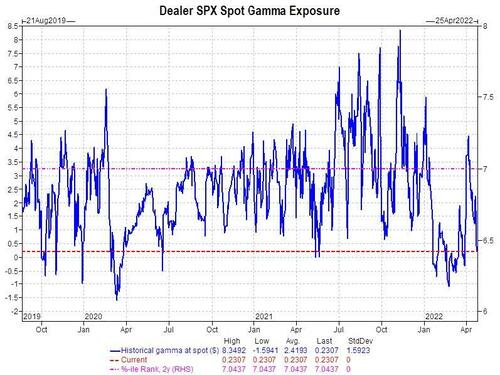
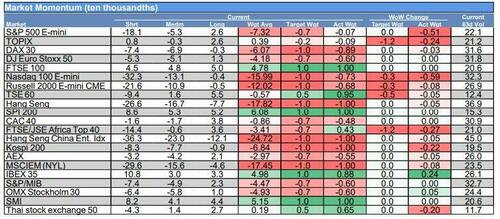
- 3. S&P Index gamma turned negative on Thursday for the first time since March.
- 4. Synthetic Short Gamma through CTA and Vol-Control strategies supply will fade over the next week (Thursday’s move will lower some of the supply expectations and Goldman’s estimates will dramatically change next week).
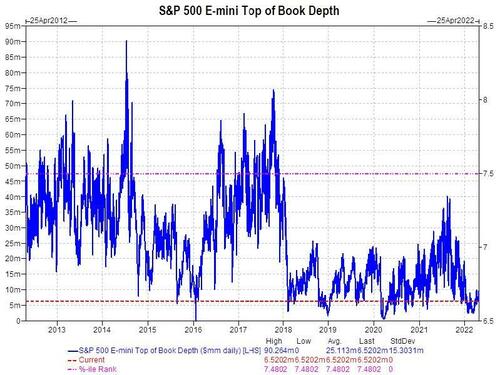
- 5. Liquidity is simply not available to try to cover liquid macro. As we noted on several occasions last week [insert hyperlink to liquidity tweet], top book liquidity in the S&P 500 futures is $2.8M. This ranks in the 1st percentile in the last 10-years. This is as low as it gets.
- 6. Sentiment is the most bearish since the market crash lows in March 2009. Rubner says that he has done “more bearish zoom calls these past two weeks, than I can recall.” The bears (AAIIBEAR) published a reading of 59.40 today. This was the highest level since March 5th 2009 (70.27). S&P500 rallied 8.54% in March 2009 and 9.39% in April of 2009. That was the generational market bottom.
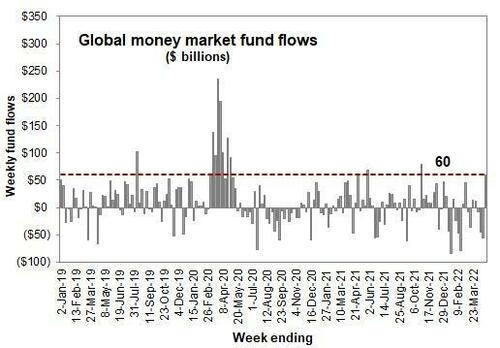
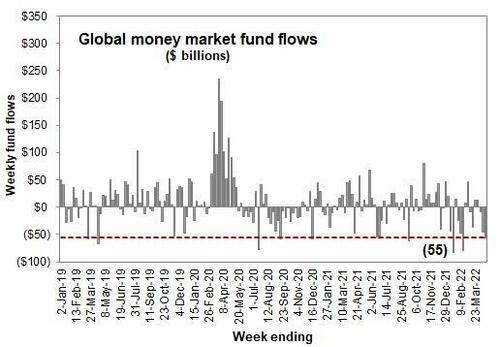
- 7. Money Market Inflows Logged a massive +$60B inflows last week, which was the largest weekly inflow since Covid 2020 (and typically another fear gauge).
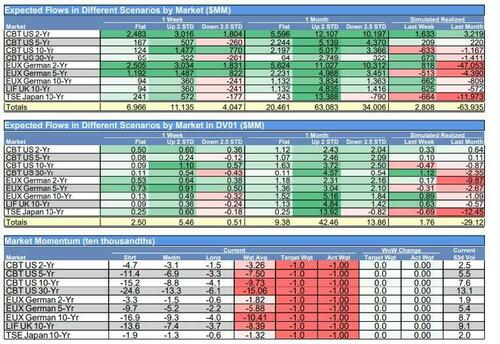
- 8. For the fixed income watchers, Goldman’s CTA models show some impressive demand. Goldman has +$20B of bonds to buy in a flat tape, but +$117B of bonds to buy in an up tape, and $37B of bonds to buy in a down tape. This should ease some of the pressure on long duration equities and largest construction of market cap.
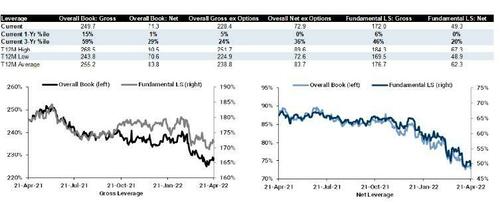
- 9. Goldman’s Prime Desk notes that hedge funds exposure is dismal. Gross and Net Exposure are currently at 2-year lows. And vs the past 5 years, Gross ranks in the 21st and Net ranks in the 38th. US TMT Megacap L/S ratio declined by -48% in the past 1-month. (~right before earnings)
- 10. Everyone is short: Short leverage (with options) ranks in the 98th percentile in the last 5 years.
- 11. New month = New Inflows. There should be some decent inflows to start May per normal rebalancing cycle in retirement accounts.
* * *
Rubner then does a more detailed breakdown of what the latest flows indicate for markets. We excerpt from the main points below (professional subscribers have access to the full note).
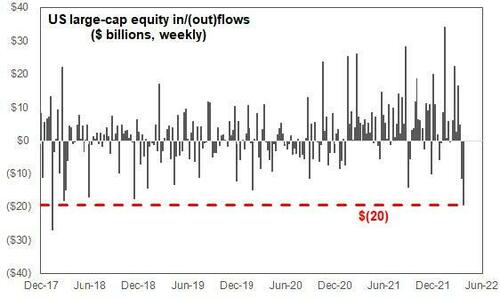
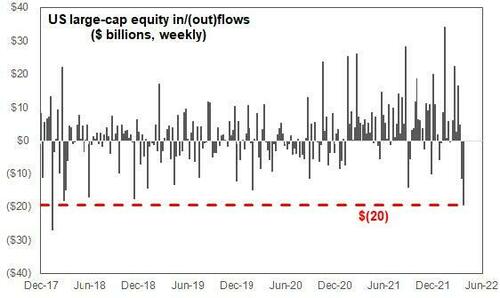
1. Passive USA Large Cap Outflows (and resulting MOC 3:50pm imbalances): = “you ask me for money and I sell”
- US Equity Funds registered their largest outflows of 2022.
- b) US large cap Equity funds registered the largest outflows since 2018.
- c) this is LIFO (last in, first out) behavior. This is where all of the new repatriated safe haven has flowed.
* * *
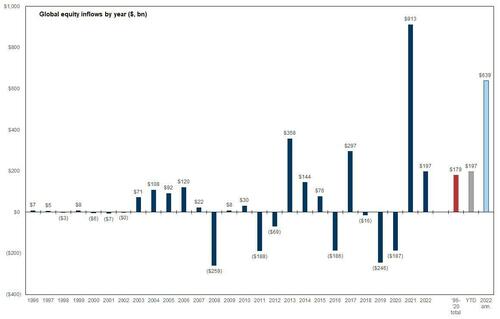
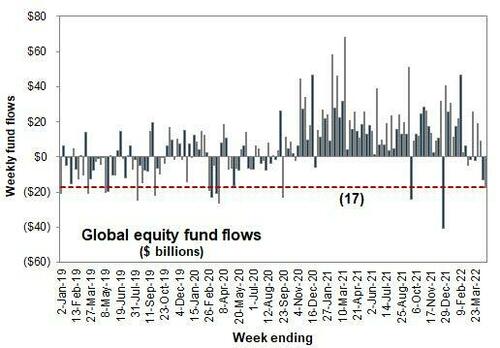
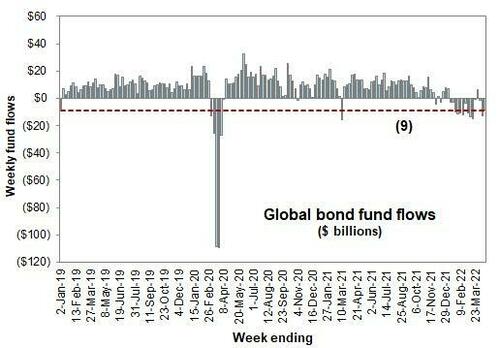
2. “Everything cross-asset outflow” - this is rare. Stocks, Bonds, and Cash all saw outflows this past week
- You don't see this very often. This is what we call an everything outflow. No lines saw inflows, and its back to checking accounts.
* * *
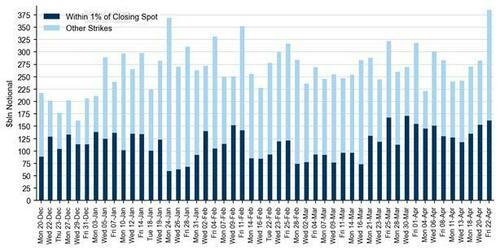
3. Retail Investors buyers of 0-1 DTE (days-to-expiry) puts are largest on record – does retail start buying calls again?
- Friday's same-day SPX were the highest dollar-volume ever traded for a single expiry on a single day
- $225bln of puts and $160bln notional of calls traded
- Already in 12 figures on Friday’s SPX expiration - $105bln in just the the first hour. Keep an eye on DTEs
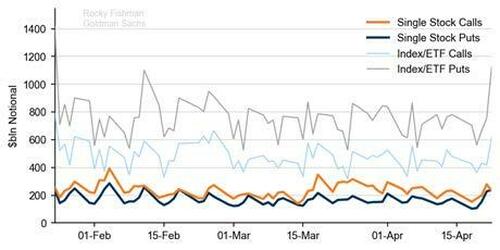
- Daily option volume Notional volume ($bln) traded in listed US equity options
Final-day trading volume: Notional SPX option volume traded on the day of expiration, excluding Third Friday and end-of-month expirations
* * *
4. Both Professional and Retail Sentiment have reached new lows. Rules and Tools have historically marked a contrarian indicator.
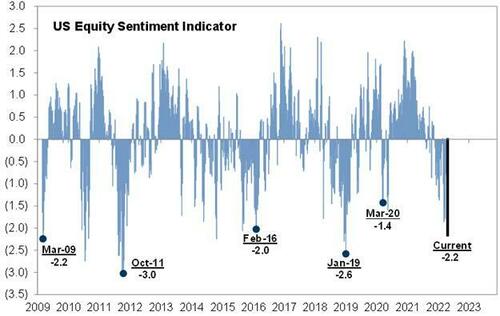
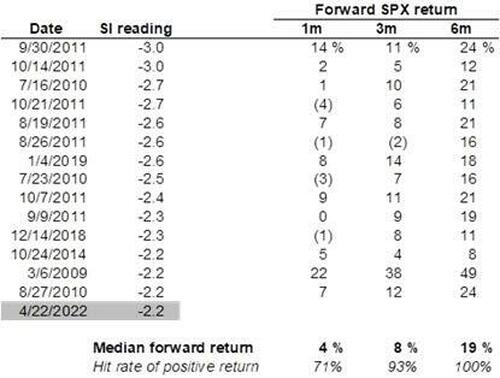
- GS sentiment indicator (SI) current reading of -2.2 is a signal of extremely light positioning and typically acts as a solid contra indicator for the market. Out of 687 weekly readings (first recording: 2/27/09), there have only been 14 instances in which the sentiment indicator was more negative (below -2.2).
- AAIIBULL (bullish investors) reached the 9th lowest reading since 1987 (1820) observations (zeroth percentile).
- Market returns after such extremely negative readings have been uniformly bullish, and the hit rate six months after such a reading is 100% (14 of 14 occasions), leading to a median 19% return!
* * *
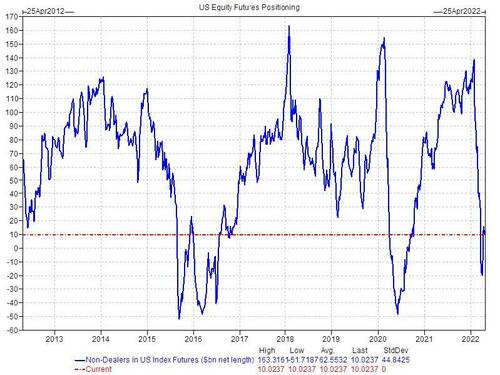
5. Futures Positioning has been unwound and ranks in the 15th percentile over the past 10 years.
- For context, the high futures position for 2022 was +$138.4B (January 25th ) vs. +$10B currently.
* * *
6. Peak Blackout is behind us. US Corporates return from the blackout window on May 2nd (Monday). The largest buyer of equities in 2022 has been out of the market for much of April and is now back.
- 51% of the S&P 500 reported last week. This is the largest week for earnings in Q1. Corporates are slowing re-emerging from the blackout.
- 2022 US corporate authorizations are off to the best year on record. Do they come back to buy stocks at these levels having already authorized? Do we hear about more big authorizations this week?
- GS buyback activity last week was 2.4x the bank’s average 2021 levels - despite being in the earnings 'blackout window.’ the bank estimates ~59% of companies will emerge by this time next week
* * *
7. S&P Index Gamma (no longer long) given institutional “forced hedging” of May puts – do we see monetization of puts after the big FOMC event next week?
Dealer long gamma has been unwound, and works in both directions. This will exacerbate, not buffer moves in the same direction as the market.
* * *
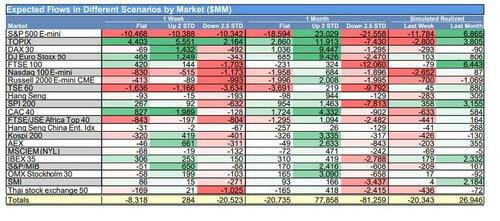
8. Systematic Equity Supply is far smaller than some have feared given recent deleveraging.
- Goldman calculates that CTA strategies have to sell $8B over the next 1 week and $21B to sell over the next month.
- In an up tape, CTA strategies have up to buy $78B vs. down tape -$81B to sell. Said otherwise, they will continue to trade negative synthetic gamma in the same direction as the market
* * *
9. Synthetic fixed income short gamma (CTA strategies) have triggered flip levels. Does FI demand ease pressure on rate move and long duration equities?
- Bond yields lower = SPX construction higher? This might be important chart for equity traders given the large cap tech weighting of the indices.
* * *
10. S&P 500 Top Book Liquidity “works in both directions”
- Liquidity in the most liquid equity future in the world ranks in the 7th percentile in the past 10 years, and offers just $6M to trade on the screens.
* * *
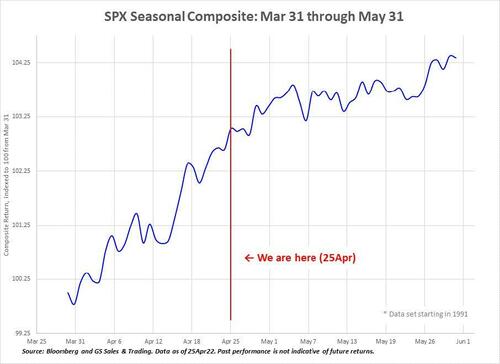
12. Seasonals – “Sell in May and Go Away” this year? Positioning is already too low to sell from here. (30-yr look back)
- This chart will matter if and when May inflows come back.
* * *
13. HF Leverage Exposure remains at cycle lows, does May the 4th become another clearing event and quick adding back of exposure?
- Overall book Gross leverage +1.0 pts to 228.4% (5th percentile one-year) and Net leverage -0.6 pts to 72.9% (lowest since May ‘20). Overall book L/S ratio -0.9% to 1.937 (lowest since May ‘20).
- Fundamental L/S Gross leverage +1.3 pts to 172% (6th percentile one-year) and Fundamental L/S Net leverage -1.1 pts to 49.3%, near the lowest levels since Apr ‘20.
As Rubner concludes, “choppy and wide trading range continues but market technicals flip in favor of the bulls for may.” One thing is clear: the market can’t take much more pain without the Fed having to step in – we are talking the proverbial “flush” - no matter how much Biden berates Powell into standing to the side as stocks crash if it somehow means that inflation will shrink – and boost Biden’s approval rating - just because we enter a bear market. Incidentally, we wonder if Biden’s handlers have considered what will happen to the president’s approval rating if in additional to a stagflationary recession, the president were to also add a market crash to his list of achievements.
Finally, for those curious how to best trade the world as envision by the Goldman flow trader, details can be found in the full note available to professional subscribers.
https://ift.tt/RMEXYAc
from ZeroHedge News https://ift.tt/RMEXYAc
via IFTTT







0 comments
Post a Comment