10-Year Treasury Yield Plunges To Just 1 Basis Point Away From Recession "Tipping Point"
After more than a month of shocking complacency (because what, central banks will somehow print antibodies and "fix" the covid pandemic which will restore collapsing global supply chains?) traders are "suddenly" realizing that the coronavirus outbreak contains a significant likelihood of impact to the global economy and the potential to become a black bat, pardon, black swan type event. An event which could quickly spiral into a US - and global - recession.
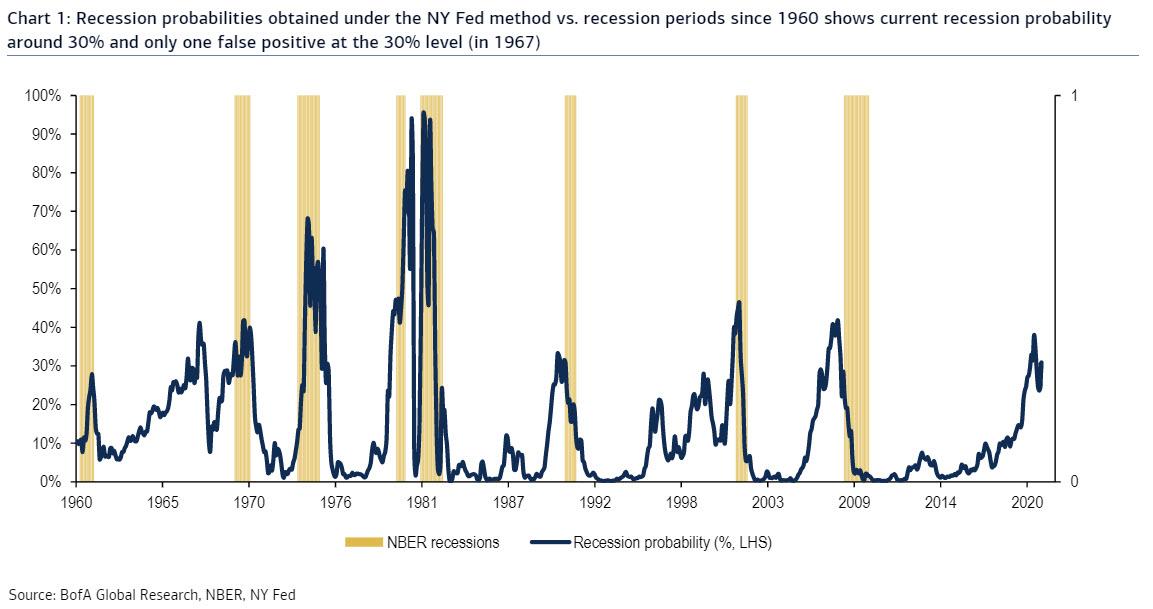
How to determine if a recession is coming? One place to watch is the NY 'sFed recession probability indicator, which is a function of the slope of the curve between 3m bills and the 10y rate and was developed using a logistic regression technique. As BofA writes, going back to 1960, there have been 8 recessions, but comparisons with the last 3 recession are likely more relevant. Chart 1 shows that within a 12-month window prior to each of the last 3 recessions, the probability exceeded 30%. If we look at all 8 recessions since 1960, we find that the critical 30% threshold remains relevant back to 1969 (7 recessions), but provided a false positive in 1967 and was not reached in the 1960 recession.
Yet while a 30% recession probability is still a gray zone, once the NY Fed's indicator reached a level of 40% it has not provided any historical false positives.
Why is this notable? Because in the Fed's framework, the 40% level corresponds to a slope of -45bp between 3m bills and the 10y rate.
Looking at the current cycle, not only is the current probability above 30%, but it was above 40% in August of 2019, when the world was flooded with recession fears and sent a record $17 trillion in global sovereign debt into negative yielding territory. The probability indicator declined post-August as the Fed's 3 cuts steepened the curve, but given the current reading - and the August reading - versus the critical 30% level of the past 3 recessions, BofA warns that we "have to view the recession outcome as significant enough to consider hedging against."
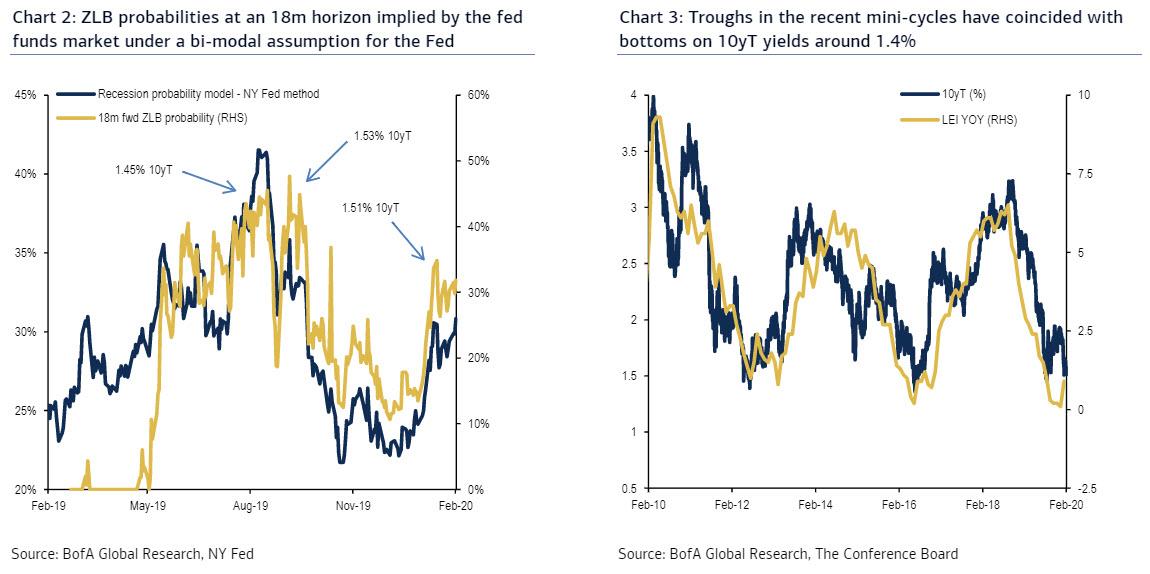
Furthermore, when looking for recession proxy signals, BofA focuses squarely on the probability of a zero lower bound (i.e. fed funds rate cut to 0%) in 18 months (this is shown in chart 2 below). With this approach, BofA obtains roughly one in three chance of seeing the Fed at the ZLB by mid-2021, corroborating the above.
What does all this mean for the 10Year Treasury as a recessionary signal?
According to BofA, recent mini-cycle troughs have coincided with bottoms on 10y Treasury yields around 1.4% (as shown in chart 3 below for The Conference Board Leading Indicators and 10yT yields since the great recession).
More importantly, breaking through this "tipping point" level requires more than 50% probability priced for the Fed cutting rates back to 0%! This means that breaking 1.4% in an on-hold context for the Fed creates a significant inversion of the curve, pushes recession signals higher, and pressures a further inversion of the FF1/FF6 spread which we found in Pricing cuts ahead of the Fed to have no false positives for Fed cuts following a -30bp inversion (currently -16bp).
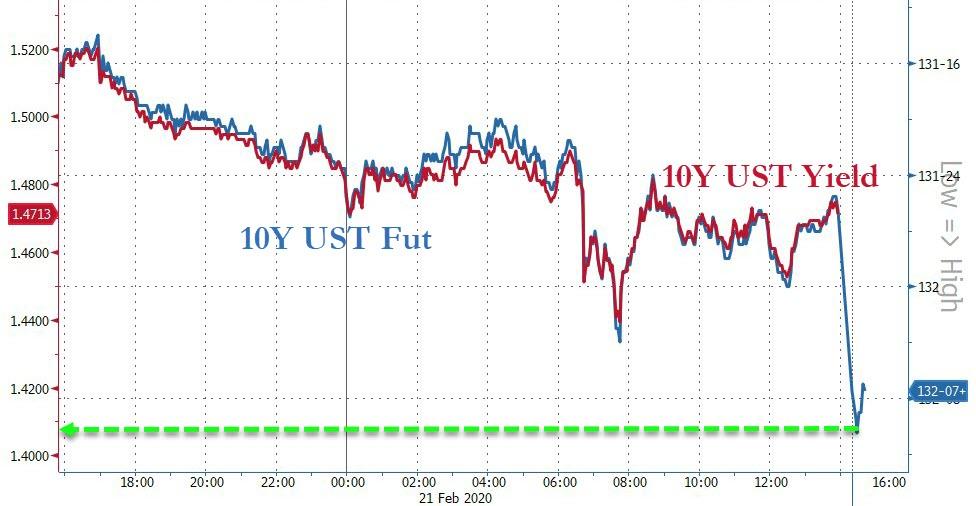
As of open of trading on Sunday evening, the implied 10Y yield is 1.41%, or just 1 basis point above this critical "tipping point" below which trapdoors to both a recession and the Zero Lower Bound are open.
What this means in practical terms from a duration perspective is that "the market may gap lower on a break below 1.4% for the 10Y Treasury", as this corresponds to phase transition higher in recession probabilities and a clear challenge to the on-hold Fed stance, "particularly as convexity flows add to what would likely be a broader risk-off move. "
Finally, while the threshold for cuts is high - especially if a slowdown is driven by pandemic fears - and considering the Fed's recent rhetoric which has sought to allay expectations of a rate cut as soon as June, once the Fed commits to cuts, BofA finds it unlikely that they will be the insurance style of 2019, and instead the Fed will proceed to cut all the way to zero to avert the coming recession. For the curve, this implies some scope for further bull flattening, but limited beyond 1.4% in the 10Y, as the Fed is likely to be more significantly priced in beyond this level.
And while BofA goes on to list several ways to hedge this eventuality, the simple take home here is that if the 10Y tips below 1.40%, it will proceeds to plunge straight down, which in turn will force the Fed to change its "reaction function" again, and announce that an aggressive rate cut phase is coming, one which will be meant to offset what the market is now saying is a virtually assured recession. It also means that anyone hoping the Fed will further taper its QE4 in coming months is in for a rude awakening.
https://ift.tt/2Vc7Yuh
from ZeroHedge News https://ift.tt/2Vc7Yuh
via IFTTT


0 comments
Post a Comment