A Far Greater Risk Emerges: Bond Market Liquidity Is Quietly Collapsing
In recent weeks we have repeatedly directed attention to the woeful liquidity in the e-mini S&P future, arguably the most important contract behind the broader US equity market, where book depth has collapsed to levels last seen during the March 2020 crash when just an order size of just 4 million could move the contract by 1 tick.
This has translated into violent and often painful swings in the S&P, leading to a surge in intraday volatility which has reflexively reinforced the market's sharp downdraft in the past month, which in turn has led to even less liquidity, and so on.
Yet while stocks have seen a surge in volatility in the past month coupled with a collapse in liquidity, bond markets have remained relatively resilient despite the Fed's upcoming quantitative tightening.
That's about to change.
As Bloomberg's Edward Bolingbroke writes, liquidity in the world's (normally) deepest and most liquid market, that of U.S. Treasuries, is eroding again, as the past week’s controversy about how much and how quickly the Federal Reserve will raise interest rates this year unleashed a bout of extreme volatility in yields.
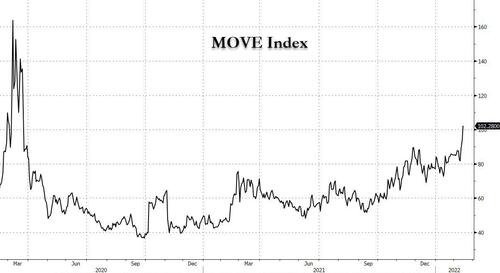
Not only has this translated into a surge in bond market volatility as measured by the MOVE index, which has spiked to the highest level since March 2020...
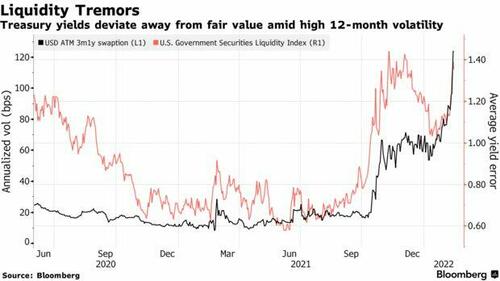
... but the Bloomberg U.S. Government Securities Liquidity Index - a gauge of deviations in yields from a fair-value model - is approaching last year’s highs, reached in early November. At that time, expectations for Fed hikes had begun to mount in October, causing historically large daily swings in short-dated Treasury yields in particular.
Volatility has soared amid growing fears that the Fed could unveil a half-point rate increase in March, which on Feb 10 spurred the two-year note’s yield to rise 21 basis points, its biggest increase since 2009. The same day a gauge of expected volatility in U.S. rates over the next 12 months reached the highest level since May 2010, a period of spectacular volatility in U.S. stocks.
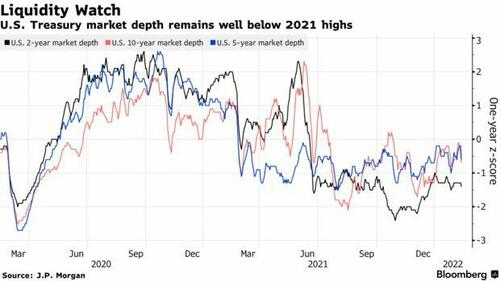
“As volatility has picked up, market depth has fallen,” JPMorgan rates strategists Jay Barry wrote in a Feb. 11 note, adding that the “softer Treasury market liquidity acted as an accelerant in the latest moves." Market depth, a key measure of liquidity -- derived from the sizes of bids and offers on the BrokerTec trading system -- is depressed for all Treasury tenors, and worse for two-year notes than for the five- and 10-year.
Meanwhile, with Treasury short positions anticipating higher yields elevated and continuing to grow, Bollingbroke warns that liquidity will be essential to avert a dramatic repricing lower in yield in the event of a reversal in sentiment that drives investors out of those positions.
But it's not just treasury bond market liquidity that is collapsing: corporate bonds are about to be hit as well.
As Goldman's Lotfi Karoui writes today, despite record mutual fund outflows, the performance of the USD high yield corporate bond market relative to other risk assets such as equities has been quite resilient, even though it has clearly blown out in recent weeks.
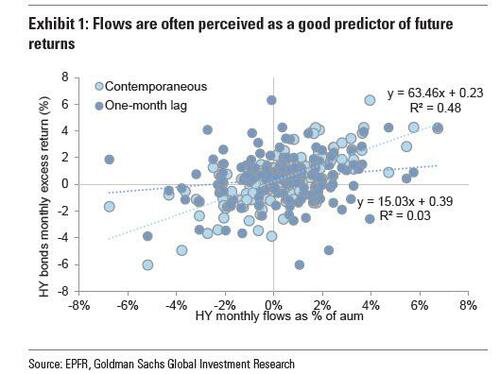
The good news is that while outflows are truly concerning, they make bad predictors of future performance. As Karoui explains, in the eyes of many fixed income investors, mutual fund flows are a key metric to gauge market sentiment and get clues on future performance. And while the Goldman strategist doesn’t dispute the information content of mutual fund flows as far as risk sentiment goes, he says that he has long been skeptical of any potential causality between the direction of fund flows and future performance: "as we discussed a few weeks ago, the empirical evidence suggests a weak relationship between flows and future performance (at least over relatively short-term horizons). And while the contemporaneous relationship is stronger (Exhibit 1), it is not indicative of any causal relationship. Rather, it merely suggests that flows and returns have a common driver."
The trajectory of (outward) fund flows in the USD HY bond market thus far this year has been a case in point. Data collected from EPFR show that USD HY bond funds experienced net outflows of $15.8 billion, equivalent to 3.8% of the beginning of the year’s AUM. Putting this in context, the erosion in AUM represents the worst start to a year since 2010, and is partly reflective of a strong rotation into the floating rate leveraged loan market. Meanwhile, since the start of the year, bank loan funds have added roughly $9.2 billion in net inflows. These net inflows have allowed AUM to grow by an impressive 10% since the beginning of the year.
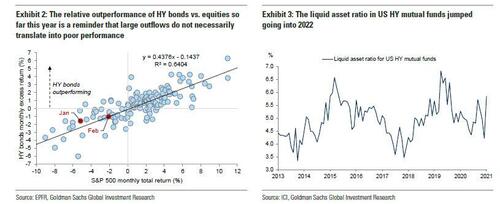
Here Karoui claims that despite the sizable outflows from USD HY bond funds, "there is little to suggest any material impact on secondary market performance. Since the start of the year, HY bond spreads have widened – but this widening has been a reflection of investors’ reassessment of the forward path of macro fundamentals, as opposed to any technical pressure from these large outflows." Indeed, as shown in Exhibit 2, HY bonds actually outperformed their beta to the S&P 500 in January, and have since been moving in-line (which is in large part due to the excessive volatility and liquidity collapse of the US equity market). And while the Goldman credit strategist suspects the decent cash balances of HY mutual funds going into the year have likely helped absorb the outflows (Exhibit 3), he notes that the relative outperformance of HY bonds vs. equities so far this year serves as a useful reminder that large outflows do not necessarily translate into poor performance, and that flows and returns both respond to investors’ aggregate level of risk aversion
Still, even Goldman has to admit that the impact of this year’s massive HY outflows has become more visible in recent weeks, especially when it comes to market microstructure.
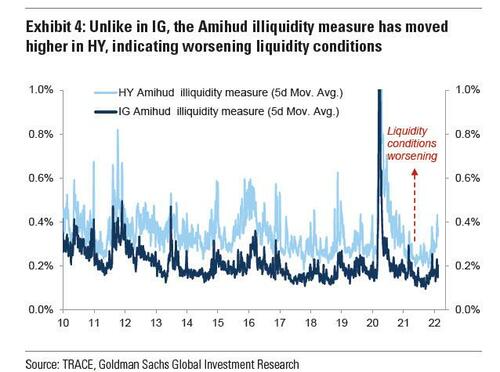
As shown below, the Amihud illiquidity measure, a proxy for the price impact of the order flow, has increased in February, having held up quite well prior to that. This uptick suggests rising headwinds for risk intermediation. While it is true that the uptick could just reflect a normal response to the high volatility regime that has prevailed since the year started, as Exhibit 4 shows, the same measure has been better behaved in the IG market, which suggests that outflow-related idiosyncratic factors have likely weighed more on the secondary HY bond market relative to its IG counterpart. As Goldman concludes, further amplification of the recent outflows will likely provide more clarity on the strength of the market microstructure and the risk of a repricing of liquidity premia.
And while Goldman is waiting, the bottom line is clear: the liquidity vacuum that has hammered stocks and has led to rollercoaster swings, is transitioning to both the credit and government bond market, and unless capital markets get some bullish trigger - arguably from the Fed - that sees liquidity "refilled", the next market crash will not be limited to just stocks, but will drag both bonds and govvies lower.
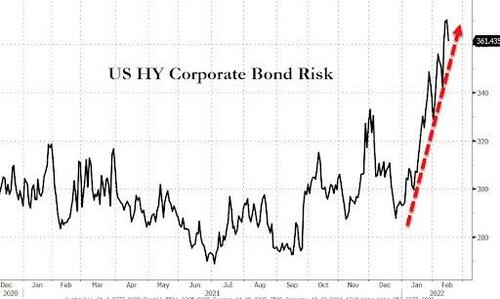
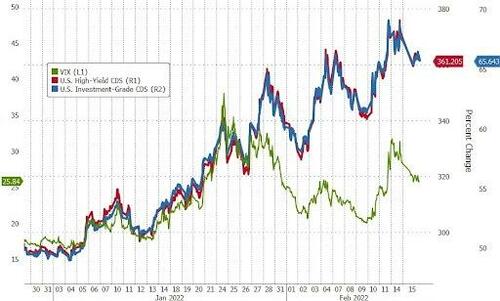
How much lower? Here is one indication of how big the chasm currently is - a new drawdown could be dire for stocks (as equity risk - VIX - catches up to credit risk)...
... but could also be just the catalyst that will wake the Fed from its current hawkish stupor, forcing the central bank to finally prop up US markets as it has traditionally done over the past decade.
https://ift.tt/GQeVXk3
from ZeroHedge News https://ift.tt/GQeVXk3
via IFTTT




0 comments
Post a Comment