Five Charts To Watch For When The Low Is In
By Simon White, Bloomberg Markets Live commentator and analyst
Liquidity and tactical equity indicators do not yet indicate a capitulatory low in U.S. equities.
The market is trying to find a bottom, but we are not there yet. Liquidity is poor and continues to point to more equity volatility ahead, while tactical indicators are not yet at levels seen at previous bottoms.
Market tops are processes, while market bottoms tend to be points in time. Tops can play out over many months, but bottoms are often sharp and sudden and the rally afterwards can be as aggressive as the initial sell off.
Catching a market bottom can therefore be very profitable if you get the timing right. That is why it pays to watch for signs of capitulation. The following charts show that while signs of stress are growing, we have not yet had the sort of capitulatory move associated with previous market bottoms.
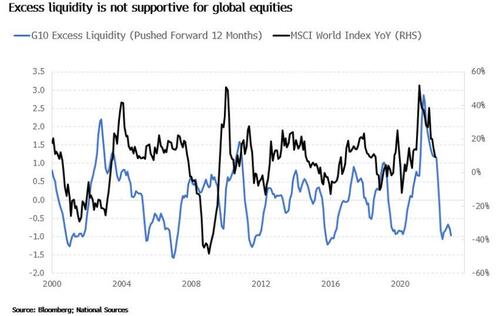
The first is liquidity. Excess liquidity is the difference between money growth and real economic growth. Therefore it is a measure of the liquidity “excess” to the needs of the real economy and so available to support risk assets. Declining money growth and rising inflation have taken excess liquidity much lower, which points to more downside for US and DM equities.
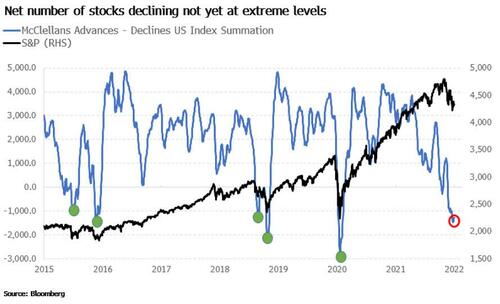
Second is advance vs declines, in other words, the cumulative number of stocks on the NYSE advancing minus those declining on a daily basis. This has been falling but is not yet at a level associated with the late 2018 and 2020 lows.
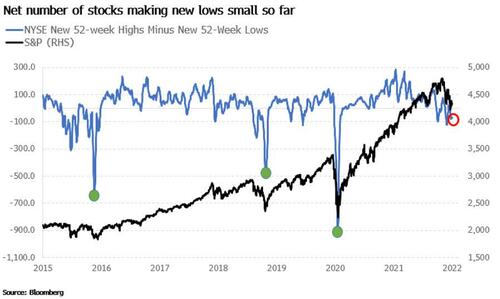
Next we have the number of new highs minus new lows. This is the number of stocks on the NYSE making new 52-week highs minus those making new 52-week lows. At flush-out bottoms, significantly more stocks are making new lows than we have currently.
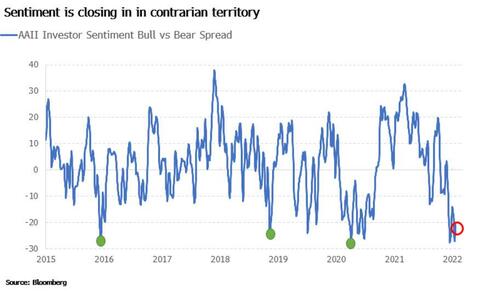
Sentiment is a contrarian indicator. As Warren Buffet put it, “be fearful when others are greedy and greedy when others are fearful”. The American Association of Individual Investors’ Bull vs Bear Sentiment spread has fallen is approaching contrarian levels, but it has room to fall further before a bottom is in.
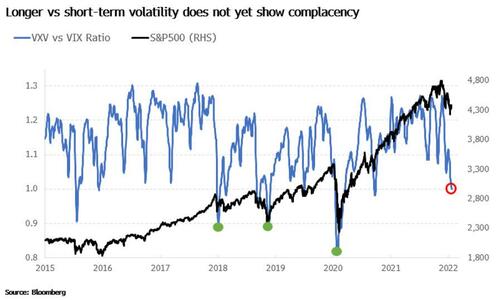
Finally we have the VXV/VIV ratio. This is the ratio of longer-term equity volatility to short-term equity volatility (3 month vs 1 month). When it is high it implies complacency in the market as longer-term volatility is rising but short-term volatility is relatively low. The VXV/VIV ratio has recently been falling, but remains much higher than at previous significant market bottoms.
Put/call ratios are also not yet at elevated enough levels consistent with panic buying of downside protection.
Investors should brace for more volatility, further equity downside, and for the value-growth rotation to continue. More emphatic signs of capitulation are needed before assuming a tradeable bottom is in.
https://ift.tt/bw3u8RF
from ZeroHedge News https://ift.tt/bw3u8RF
via IFTTT




0 comments
Post a Comment