Understanding Long Term Moves In Gold, What's Going On?
Authored by Mike Shedlock via MishTalk.com,
To understand what has happened and what is likely to happen, look at faith in the Fed and central banks in general...
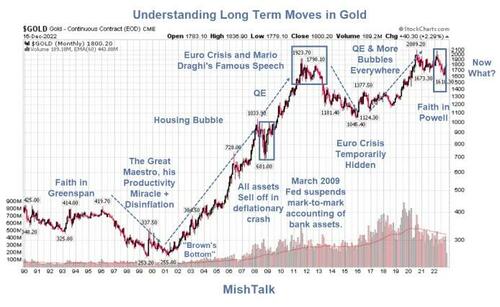
A long-term chart suggests the real driver for gold is not inflation, not the dollar, not conspiracies, not China, and not oil, but rather faith in central banks.
Timeline Synopsis
-
Nixon closed the gold redemption window on August 15, 1971. The price of gold was $35 an ounce.
-
Faith in the dollar and central banks collapsed. Inflation soared.
-
Gold peaked at $850 per ounce on January 21 1980.
-
That's when Fed Chair Paul Volcker jacked up interest rates to 20 percent to squash inflation.
-
Volcker was followed by Alan Greenspan, deemed the "Great Maestro".
-
There was inflation every step of the way yet, gold fell from $850 an ounce to $250 an ounce proving gold is not an inflation hedge.
-
In the period between 1999 and 2002, Gordon Brown, UK Chancellor of the Exchequer (roughly the equivalent of the US Secretary of Treasury), sold off 395 tons of gold, showing great faith in fiat currencies over gold. This event is known as "Brown's Bottom".
-
To bail out banks that invested in worthless DotCom companies and also lost then huge amounts of money on bad loans to South American countries Greenspan recklessly lowered interest rates and held them too low too long.
-
Gold took off thanks to Fed stimulus that culminated in a housing bubble and bust.
-
Gold, like everything else sold off hard in that bust. In March of 2009, the Fed suspended mark-to-market accounting of bank assets. The stock market took off and so did gold.
-
The Fed launched QE and so did the ECB. Credit stress in the EMU was also brewing. There was a huge risk of the Eurozone would break apart. Greece was the weak link but fears were of a cascade if Greece left.
-
On 26 July 2012, the President of the European Central Bank, Mario Draghi, delivered a speech at a conference in London that brought a crucial turnaround in the euro crisis.
-
Mario Draghi said "Within our mandate, the ECB is ready to do whatever it takes to preserve the euro. And believe me, it will be enough.’
-
What did Mario Draghi do? The answer is amusing. Absolutely nothing. However, eurozone bond yield collapsed, temporarily saving the day.
-
In 2016 the Fed and ECB were both engaging in more QE and sovereign yields went negative in Europe and Japan. Gold blasted to a new high, double topping in 2021.
-
In 2022 the Fed finally got around to hiking. Gold started dropping hard in 2022 despite the fact that year-over-year inflation topped 9 percent. Once again this shows gold is a poor inflation hedge.
-
The Fed has kept up a steady stream of hawkish talk and here we are.
Fed's Resolve
It was time to go to the gold sidelines when it was clear the Fed was about to go on a major hiking cycle.
I made a mistake in not believing the Fed's resolve. By the time I did, I felt there was not much more downside.
Gold is up nearly $200 an ounce from the lows.
The Fed Projects Interest Rates Higher for Longer at Least Through 2023
On December 14, I commented The Fed Projects Interest Rates Higher for Longer at Least Through 2023
A parade of Fed governors offering the same take.
Sure doesn't sound like Fed is taking a "wait-and-see" approach when it comes to interest rates ... https://t.co/3cG0IBfZ1S
— Richard Field (@tyillc) December 17, 2022
Gold doesn't seem to believe that although it did react poorly on the announcement.
Q: Can gold and Powell both be right?
A: Yes, in a way.
Gold also reacts to credit stress. It soared following Nixon shock, in the housing bubble, and with QE.
It plunged under Greenspan disinflation and after Mario Draghi made his "Whatever it Takes Speech"
Meanwhile, the Fed seems hell bent on breaking something and I suspect they will.
Gold Weekly Support Levels
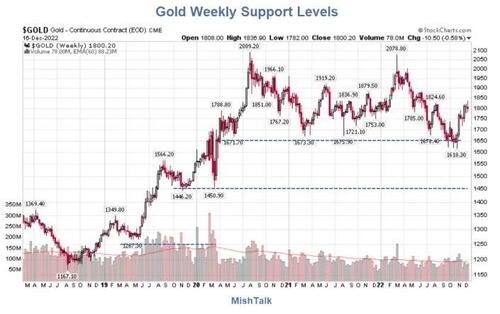
It's possible gold is reacting to pending credit stress in the US, EU, China, or elsewhere. It's possible that the $200 bounce is purely technical off strong support at $1650.
$1450 is also strong support. 1550 has moderate support. There is pretty strong resistance in a range $1850 to $1900.
If you believe the Fed will produce some uneventful soft landing with steady disinflation, gold may not be where you want to be.
Meanwhile, talk on Twitterland is of a new gold repricing model, of oil priced in gold, of yuan backed by gold, of 9 year cycles, and central bank buying gold was bearish then and bullish now, with price targets of $9,000. All that discussion seems more than a bit silly to me.
Finally, the lead chart shows gold is in a major 10-year cup and handle setup, normally a bullish formation. And typically, the longer the consolidation, the bigger the move when it happens.
The other side of the coin, as addressed in my previous post, is that bullish formations and support levels often fail in bear markets while resistance and bearish formations fail in bull markets.
That's both sides of the gold case in one post without all the hype.
What About the Dollar?
Don't fall into the trap of thinking gold always moves with the dollar. With the US dollar index at 90, gold has been at $250, $1,400, $1,200, and $600.
On a short term basis gold tends to move with the dollar, but sometimes, even for long periods of time, it doesn't.
And while price correlation tends to be present, magnitude isn't which is how you get $1,400 gold and $400 gold with the dollar index in the same place.
* * *
Like these reports? I hope so, and if you do, please Subscribe to MishTalk Email Alerts.
https://ift.tt/LmiD25G
from ZeroHedge News https://ift.tt/LmiD25G
via IFTTT


0 comments
Post a Comment