Goldman: For The First Time In 2022, We See Massive Net Inflows Into Stocks This Week
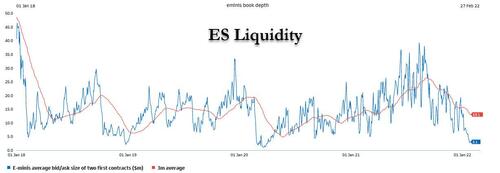
One week ago, when the turmoiling market was on edge over even the smallest tremor following a record-ugly start to the year for risk assets, and emini liquidity hit the lowest level since the March 2020 crash meaning even a modest buy or sell program could move spoos by dozens of points...
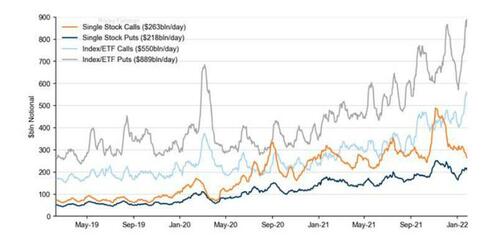
... Goldman's flow trader Scott Rubner pointed out something which changed the facade of market risk dynamics overnight: a record number of index puts had been purchased by institutional investors who were hedging further downside en masse, in effect putting an end to the liquidation panic.
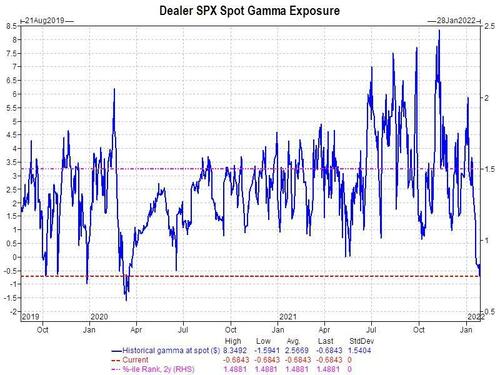
That, coupled with a near record negative dealer gamma...
... which could only go up as risk bounce and shorts were squeezed, and several other reasons why the furious selloff was exhausting itself, helped explain why stock managed to stage a remarkable rebound - at least until Facebook's meta-hearse implosion - and yet the S&P still closed well in the green last week.
So now that the bulk of earnings season has passed, and despite some high profile tech misses - most notably Facebook - is it safe to say that markets have finally stabilized? For the answer we go to Rubner's weekly tactical flow of funds note, which recaps where investors are putting their money to work in 2022. What is most notable this time, is that according to Rubner, while we are still not “all clear” after week 5, for the first time in 2022, net demand is set to exceed net supply this coming week. Meanwhile, all eyes remain on key-technical levels...
Here are the biggest highlights from Rubner's latest Flow of Funds note (as usual, the full note is available to professional subscribers):
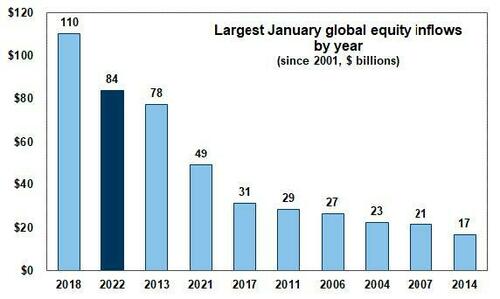
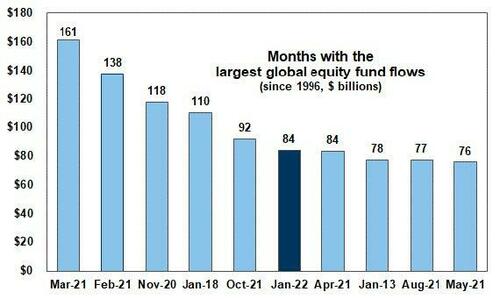
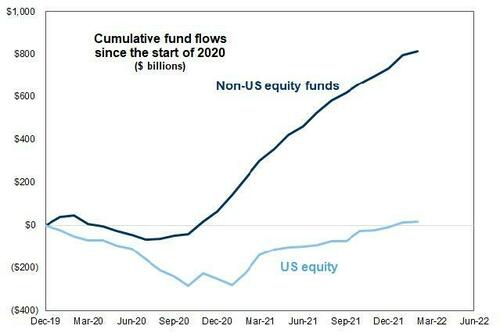
1. Global Equities logged a massive +$106B worth of inflows YTD. Annualizing ~$1.2 Trillion. January 2022 Equity inflows logged the second best start to the year on record with $84.2 Billion worth of inflows. And yet, Rubner notes that this time there is a twist: the biggest theme in the market place, this new money is going into Rest-of-World Equities, not US. This, as the Goldman trader notes, is new.
2. January 2022 Equity inflows logged the 6th largest monthly inflows of all-time
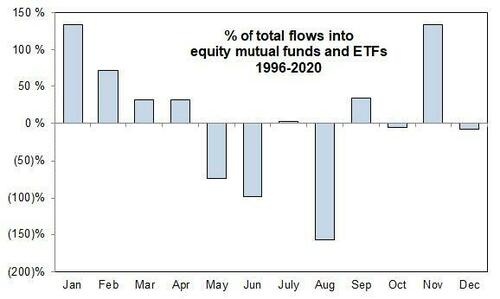
3. February is historically the 3rd largest month for inflows and 2nd largest in 1H. Investors are rotating now.
4. ROW board room demand exceeds USA board room demand. European equities logged +$4.818B worth of inflows this week. This is the largest weekly inflow since May 10th, 2017 (+$6.059B) – post ECB (out of bonds). But it is Emerging Market Equities that have been the 2022 Allocation winner, with back to back to back to back inflows.
5. YTD scoreboard: For context in USD terms: Brazil #2 (+11.89%), Colombia #3 (+10.58%), Peru #6 (+9.06%), and Chile #9 (+7.46%) vs. SPX -6.06%, significantly benefits from these non-USD inflows, and have broadly not seen inflows during this cycle.
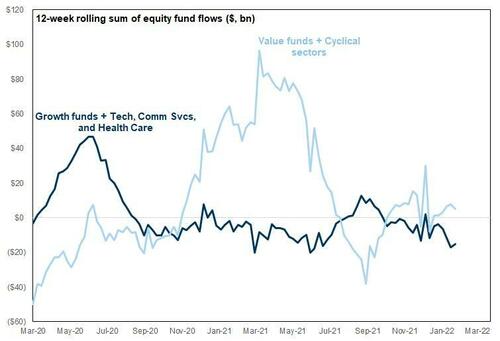
6. Value/EM/ROW/Cyclical 2022 board room allocations have room to expand in the context of what happened in January 2021 (lasted until March Quarter-end). i.e., when investors rotate in a big way, it lasts for a few weeks.
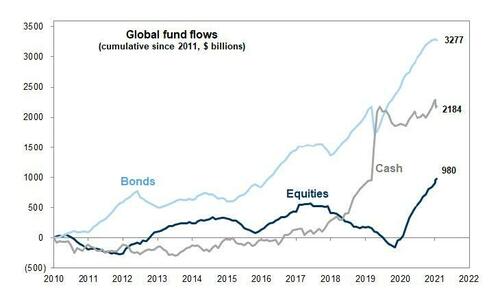
7. Inflows into Equities is a “2021 new thing”. The cumulative 10-year inflows into stocks before 2021 was zero. Bonds have seen 3x more inflows than equities and Cash has seen 2x more inflows than equities over the past decade. Rubner writes that "I am watching this chart, as I am watching yields this morning."
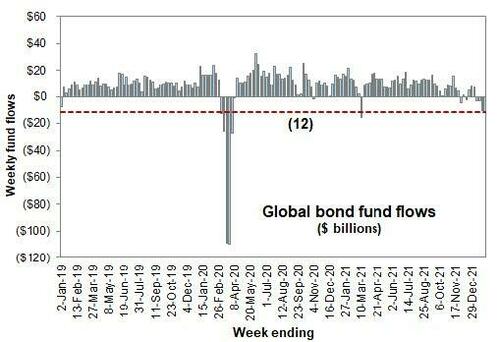
8. Bond “outflows” are not very common. There is just too much money sitting in bonds for RIA/PWM allocations if yields continue to move higher. But now outflows are rolling.
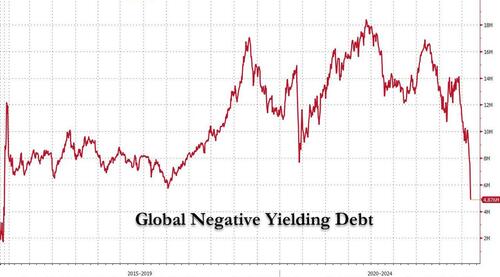
Rubner says that he has become popular among credit pods who are tracking “passive credit outflows”. -$1.5 Trillion of negative yielding bonds went “non-negative” on Thursday, the largest 1 day on record. Negative yielding bonds are now below $5 Trillion, the lowest level in over five years years (and down from a record $18 Trillion).
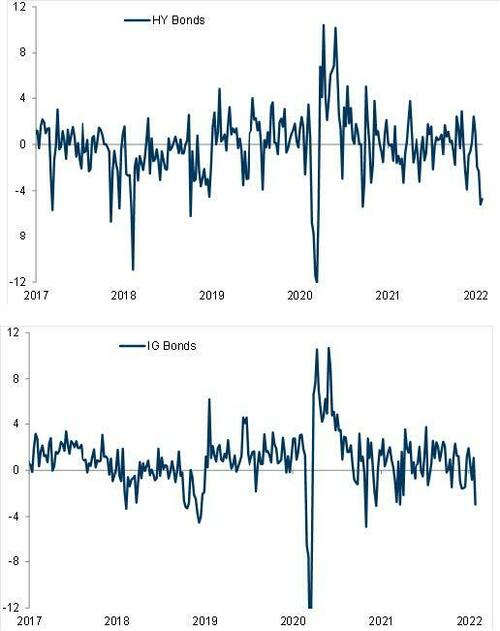
9. Investment Grade Bonds and High Yield Bonds drove the outflows from bonds this week. Watch further widening in CDX HY. We like HYG and LQD put spreads. This is also new.
Key flow highlights aside, and looking at Mark-to-Market post Payrolls, Rubner writes that in his view, "we have not met the conditions to go from “Red Light” to “Green Light” this week, but I think we are certainly in yellow and improving " as conditions are in place move back from systematic to subjective and markets will move more freely. The Goldman trader hopes "to clear the last end of this systematic checklist in week 6. All eyes, on 4438, the 200-day moving average, which needs to hold after the weekend."
Another potential bullish inflection point: Systematic Selling fades after next week, after a lot of selling
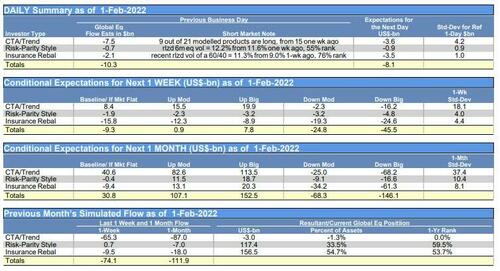
10. Systematic Supply. Similar to Nomura, Goldman estimates that systematic strategies sold -$74.1B over the past week and -$111.9B over the past one month. That is a lot with multiple indices currently short: But more importantly, systematic supply faded by EOD Friday and assuming a flat tape, there is +$30B of equity demand over the next 1 month. This is important because the up vs down scenarios become balanced vs. skewed to the sell side. The bottom line: CTA’s are now net short. This becomes more balanced going forward and subject to new market moves.
And while the CTA picture is increasingly favorable, liquidity is also improving, but still remains challenged.
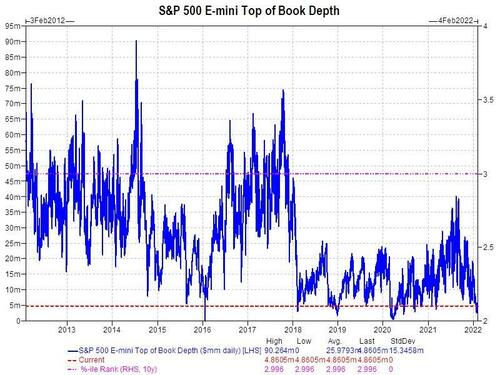
11. Liquidity. Top book liquidity in ES1 (E-mini futures) is currently $5M. The ranks in the 3rd percentile on a 10-yr rank (so zeroth percentile). There have been 6 instances in the last 10 years that top book liquidity on the S&P 500, most liquid future in the world, were this low. (This is pre-March fwiw). I find it really hard to monitor price discovery during the overnight session given lunar holiday next week. This could be really choppy.
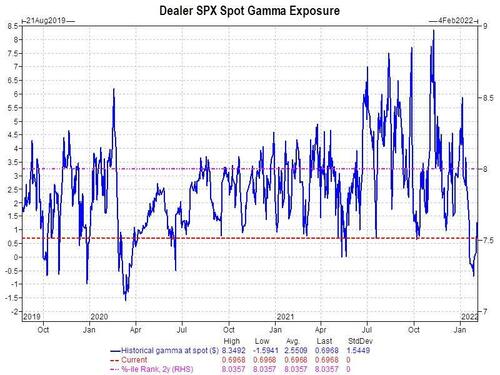
As noted above, dealer Gamma is getting longer and rebuilding:
12. Dealer Gamma. S&P 500 dealer gamma is now flat (from short). The current dealer gamma position ranks in the 8th percentile on a 3-year rank. The long dealer gamma position, which stocks have enjoyed as a market buffer for so long, is no longer present. Hedging activity has been exacerbated by those dealers hedging customer delta with demand for puts. The market could move freely both to the upside and downside, but this has mattered given the low liquidity provided by futures hedging (mostly end of day).
Just as notable, the institutional demand for index hedges - which was the highlight of last week's note - has dropped by 56% since last Monday.
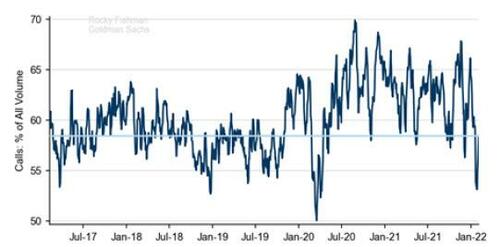
13. Put Buying. We have been averaging $1 Trillion worth of puts per day. Largest on record. There has been several days this week where put notional set records. Monday for example $2.2 Trillion notional traded in US options market, with 64% puts ($1.4 Trillion) further adding LP hedges and taking the street further short gamma.
Another notable reversal, the passive Market on Close Impact has started to improve - we have had 4 days of large MOC imbalances to buy after weeks of massive MOC for sale imbalances.
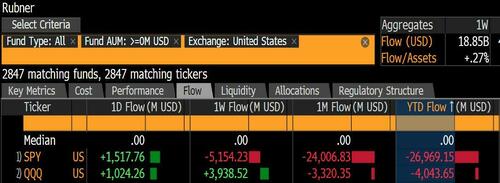
14. Equity Passive flow redemptions and MOC Impact. As a reminder, recently Rubner notes that every day, he watches MOC imbalances get posted at 3:50pm NY time, "and it feels like a new day. There are 2,670 ETF’s that trade in the US. Passive redemptions are starting to happen. SPY has seen the largest outflows YTD (-$21.8B), followed by QQQ (-$7.98B), followed by IVV (-$1.8B) outside of bonds. Inflows are still happening broadly, but these redemptions will have the largest impact. “A reminder, if you ask me for money, I sell.” 23.66 cents of every $1 of SPY sold is from the top 5 stocks. I cannot predict the outcome here, but $1.226 Trillion of capital has gone into passive funds in the last 66 weeks."
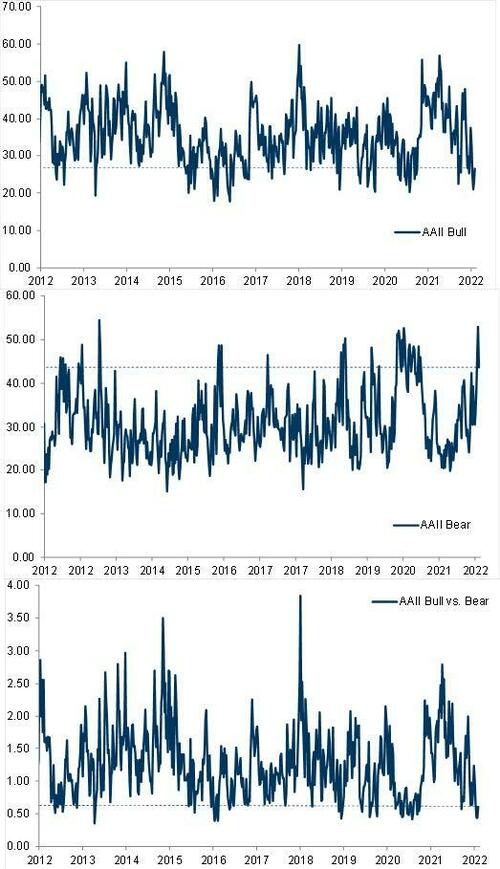
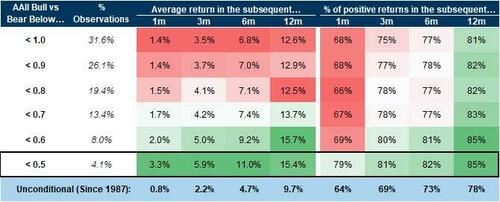
15. Sentiment. Everyone says sentiment is negative but not panic-y, well how negative? Since 1987, the AAII Bull vs. Bear has been below .45 (it is currently .44). This has only happened 51 times out of 1,799 readings or 2.8% of times. This is rare and has historically been a contrarian indicator with positive hit rates 1m (79%), 3m (81%), and 6m (82%) with high absolute returns. That said, household allocations to equities has risen, so stabilizing sentiment to reduce passive outflows will be key to watch.
16. Retail. This, as Rubner notes, has always been his swing factor. After what felt like margin/deleveraging all week from retail, this changed by the end of the week. On Wednesday, FOMC day, I have retail as a MASSIVE buyer. >$22.6B worth of retail buy demand, which ranks in the 98% percentile on a 1 year basis. This follows big sell days. The retail buy demand in tech of $9B was the largest on record, and 100% percentile.
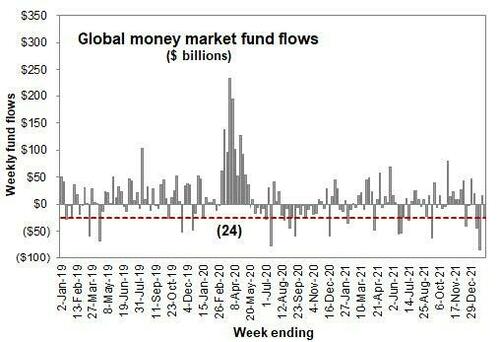
17. Money Market Funds, “cash on the sidelines”. This money has been raised, and potentially looking for a home (“down 5%”). This week saw some minor money market inflows.
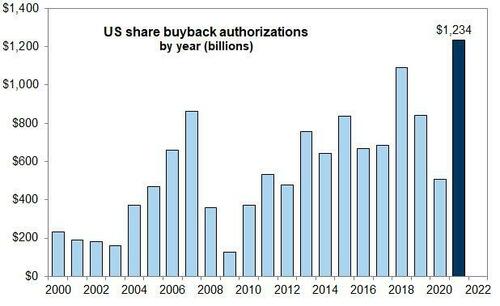
Last but perhaps most important, corporates - i.e., stock buybacks - are now coming out of the blackout window in a big way next week.
18. Buybacks. Corporate blackout window ends substantially next week, led by tech stocks, with 65% of the S&P 500 market cap coming out of the earnings blackout by Monday, and Goldman's trading desk estimates >$5.5B worth of daily demand during the open window which closes back on March 14th.
The full Goldman note is available to professional subs.
https://ift.tt/pOf4LHX
from ZeroHedge News https://ift.tt/pOf4LHX
via IFTTT




0 comments
Post a Comment