China Scoffs At Iran Arms Transfer Report, After Trump Pours Cold Water On Allegation
China has given its response on Thursday to a prior Reuters investigation which strongly alleged that Beijing is preparing to transfer up to 400 Chinese-made shoulder-fired air-defense missile launchers MANPADS to Iran.
The Reuters report was highly specific, even identifying the Hong Kong-based company that facilitated the signing of the arms deal between the Iranians and Chinese, but Beijing has rejected the report as a lie and 'groundless', saying there's no truth to it.
"China has made its position clear on relevant issues on multiple occasions. The report is not true and has no factual ground at all. China always works for peace and the end of the conflict," Chinese foreign ministry spokesperson Mao Ning announced Thursday.
President Trump had the day prior responded to the Reuters report too, saying it would be "surprising" since President Xi swore to him that arming Iran would not happen.
"I mean, things like that happen, but that would be surprising" the US president replied when asked about the report in the Oval Office on Wednesday.
Even Pakistan, which was also named as a potential facilitator of the alleged deal, strongly rejected the report:
According to the plan approved by the parties, the weapons would first be flown from Urumqi, in western China's Xinjiang region, to Pakistan and then transported to Iran, the sources told Reuters. They did not clarify whether the second leg of the journey would be by air or road. The exact quantities, delivery schedule and other details remain subject to change, the sources said.
China's Foreign Ministry dismissed the report as "completely groundless," Reuters said. The public relations wing of Pakistan's military called it "absolutely concocted and false."
MANPADS could prove especially dangerous for US helicopters and other low flying aircraft, and for Iran can serve as layer of short-range protection.
The opening days of Operation Epic Fury saw much of Iran's anti-air units get taken out, especially across the Western part of the country, giving US-Israeli jets air superiority. However, at times the Iranians have claimed to shoot down some aircraft, and since then the US has seemed to operate from further afar.
JUST IN: President Trump reacts to reports that China may supply Iran with hundreds of rocket launchers despite direct assurances from Chinese President Xi Jinping.
Trump wrote on Truth Social just last week that "President Xi, at our recent meeting in Beijing, China, told me that he would not, under any circumstances, give or sell Weapons to the Islamic Republic of Iran — And that statement included Chinese Companies."
"Considering our relationship, I take him at his word and, besides, l am doing him very big favors, also. Likewise, President Putin … told me that he would not sell Weapons to Iran," he stated. Trump continued, "Therefore, two major Countries that people speak of often in terms of Iran are, in my opinion, not participating. If they did, it would be very bad for them — Certainly not in their best interests."
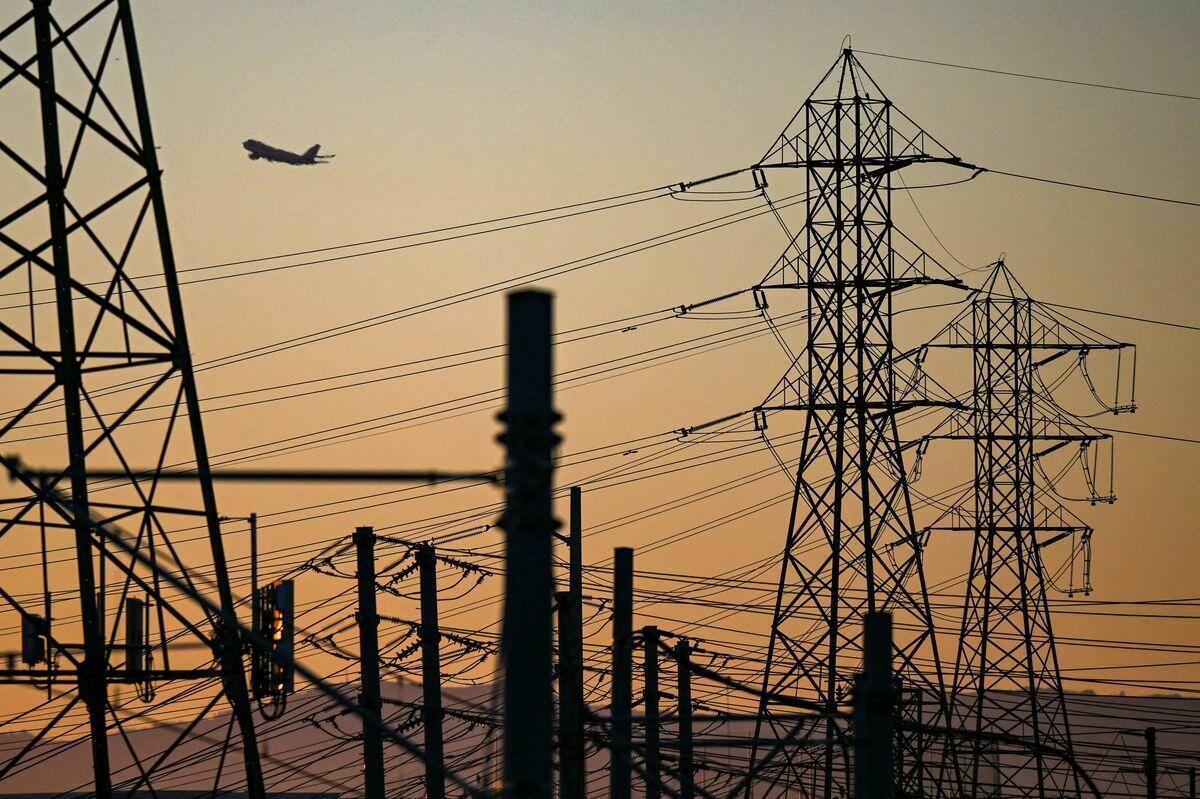
The July 26 emergency order was issued by Secretary of Energy Chris Wright to Southwest Power Pool Inc. (SPP), the regional grid operator for the 17 states.
According to the order, SPP is expecting hot weather conditions through Aug. 3. The operator requested the department to allow specific power generation units to run beyond their operating limits in order to ensure grid reliability. It also sought authority to unlock and deploy backup generation resources at data centers and other industrial and commercial customer sites to counter any risk to the bulk power system.
Wright determined that statutory emergency situations exist in certain regions, serviced by the SPP, owing to sudden increases in demand, "a shortage of electric energy, a shortage of facilities for the generation and transmission of electric energy, and other causes," the order said. Homes and local businesses in the affected areas could lose power, presenting a risk to public safety and health.
The energy secretary allowed SPP to dispatch power-generating units "as needed to maintain reliability," according to the order. In addition, SPP is authorized to use backup resources to operate as a last resort before issuing an Energy Emergency Alert 3 - the highest level of energy emergency action.
The emergency order applies from July 26 to Aug. 3.
In a July 26 statement, DOE said the order would stabilize the power grid and mitigate blackout risks, highlighting that outages cost American people around $44 billion annually.
"The Trump Administration is tapping into an abundant supply of unused backup generation to maintain affordable, reliable, and secure power for hardworking American families and businesses," Wright said in the statement.
The department estimated the total nationwide unused power generation to be at over 35 gigawatts.
The emergency order comes as the National Weather Service (NWS) predicted in a July 28 post on X that "dangerous and extreme" heat would remain across portions of the central United States this week.
In a July 28 forecast, the Weather Prediction Center said the southern United States is expected to see above-normal temperatures for the next few days, with afternoon highs reaching upper 90 degrees Fahrenheit.
High heat combined with high humidity can result in widespread "Major to Extreme HeatRisk levels," with people lacking adequate cooling or hydration at risk of heat-related illnesses, according to the center. By the end of this week, the "dangerous heat" is forecast to expand into the Southwest and Intermountain West, the center said.
Strengthening Power Grid
Amid high heat conditions, other major power grid operators have also issued operational alerts.
On July 28, the Midcontinent Independent System Operator, which serves 15 states, released a hot weather alert update as temperatures in the region are expected to hit 103 degrees Fahrenheit. The alert is effective till the end of this month.
On July 15, PJM Interconnection, the nation's largest electric grid operator that serves 13 states, had declared a hot weather alert that remained in effect through July 17. Such an alert is issued to prepare power generation facilities and personnel to meet a jump in electricity demand.
Meanwhile, earlier this year, the DOE announced $1.9 billion in funding opportunities to strengthen the U.S. power grid, with the funds coming from a five-year grid resilience program.
The funding will prioritize projects that expand grid capacity, replace existing power lines with higher-capacity conductors, improve overall system security and reliability, and lower prices for consumers.
According to Katie Jereza, assistant secretary at the DOE's Office of Electricity, the funding will stabilize and optimize America's grid operations, strengthening it for rapid growth.
Wright said in the statement that for too long, "important grid modernization and energy addition efforts were not prioritized by past leaders."
"Thanks to President [Donald] Trump, we are doing the important work of modernizing our grid so electricity costs will be lowered for American families and businesses," Wright said.
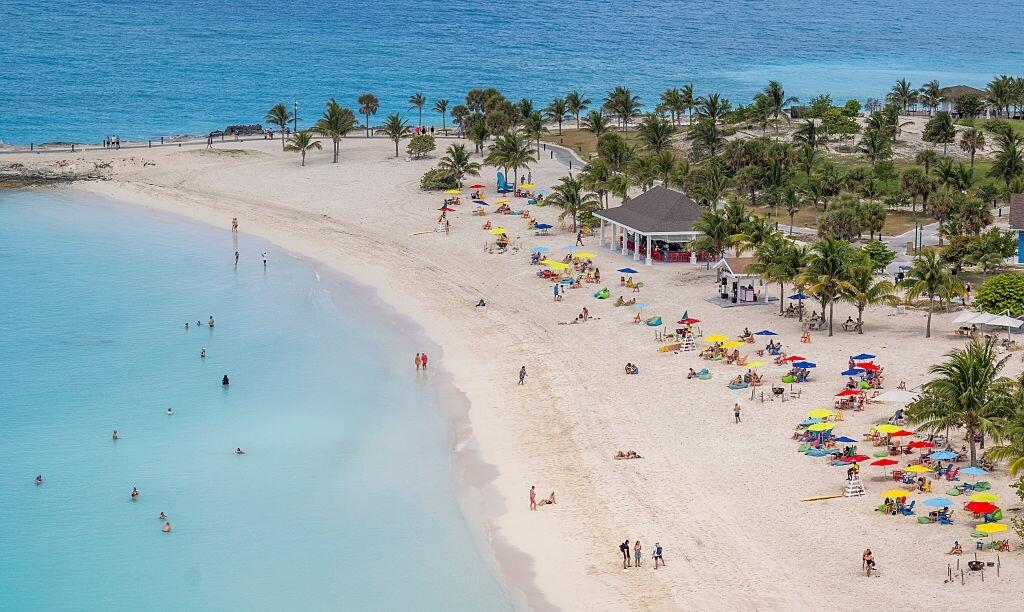
The State Department updated its travel advisory for the Bahamas, highlighting the risk of crime, including sexual assaults, in the Caribbean nation.
Violent crimes, such as sexual assaults, armed robberies, and burglaries, can occur anywhere in the country, the department said in a July 28 update.
“Most crime occurs in Nassau and Freeport on New Providence and Grand Bahama islands. Stay alert in the ‘Over the Hill’ area in Nassau, south of Shirley Street, where gangs have killed residents. Stay alert in vacation rental properties, especially where private security is not present,” the department said.
Located on New Providence Island, Nassau is the capital of the Bahamas.
The Bahamas has been designated as a “Level 2: Exercise Increased Caution” classification.
The advisory specifically warned about jet skiing and boating activities in the Bahamas, highlighting that these are not well regulated in the country. Deaths and injuries involving such activities have been reported. In some instances, jet ski operators have allegedly committed sexual assaults.
The U.S. government has banned its employees from using or renting jet skis and personal watercraft from independent operators on Paradise Islands and New Providence due to safety risks. Some watercraft operators may not be licensed or insured, and may ignore weather forecasts, according to the advisory.
In a June 15 alert, the U.S. Embassy in Nassau had warned Americans about jet ski risks in the Bahamas.
According to the embassy, at least two Americans have reported being sexually assaulted in the Bahamas this year by jet ski operators. Two such reports were registered in 2025, while three were reported in 2024.
Some of the victims alleged that operators had solicited them for rides from the small islands east of Paradise Island, downtown Nassau, and Paradise Island beaches, including areas stretching from Junkanoo Beach to Saunders Beach and Cabbage Beach.
The victims said they were assaulted on isolated islands near Nassau, according to the embassy.
In its latest advisory, the State Department warned travelers to the Bahamas to be aware of their surroundings and stay alert in public restrooms. Sexual assaults have occurred on or near beaches in downtown Nassau.
The department advised people never to swim alone and to be aware of watercraft or jet skis operating close to the shore.
In 2024, roughly 85 percent of the around 11.2 million visitors to the Bahamas were from the United States, according to data from the International Trade Administration.
In addition to the Bahamas, the State Department has issued travel advisories for other nations in the Caribbean.
A July 10 travel advisory updated the alert level for Saint Lucia to Level 2, warning about the risk of crime in the country.
American citizens and other foreigners in Saint Lucia have reported being victims of assault, armed robbery, rape, and burglary. In some instances, U.S. citizens have been killed, the advisory said.
Tourist resorts have been targets of violent crimes. Moreover, response times of local police are not as fast as in the United States.
In April, a State Department advisory warned of crime and terrorism risks in Trinidad and Tobago, designating the country with a “Level 3: Reconsider Travel” classification, the second-most severe travel advisory.
The department advised avoiding beaches, downtown Port of Spain, Fort George, and Queen’s Park Savannah after dark, warning that tourists are vulnerable to armed assault at these sites.
Meanwhile, a “Worldwide Caution” security alert was issued on July 22 by the State Department for Americans due to the heightened tensions in the Middle East.
U.S. diplomatic facilities, within and outside of the Middle East, have been targeted by rivals, with the Iranian regime and its supporting groups likely to target other American interests overseas. Targets may include locations linked to the United States and U.S. citizens anywhere in the world, such as businesses and institutions, according to the department.
“Americans currently in the Middle East should exercise caution and heightened vigilance and should be prepared for flight cancellations, periodic airspace closures, and potential travel disruptions,” the alert said.
NYC Councilwoman Sounds Alarm: Mamdani's Property Database Puts Wealthy Homeowners In Crosshairs Of "Luigi-Worshipping Leftist Thugs"
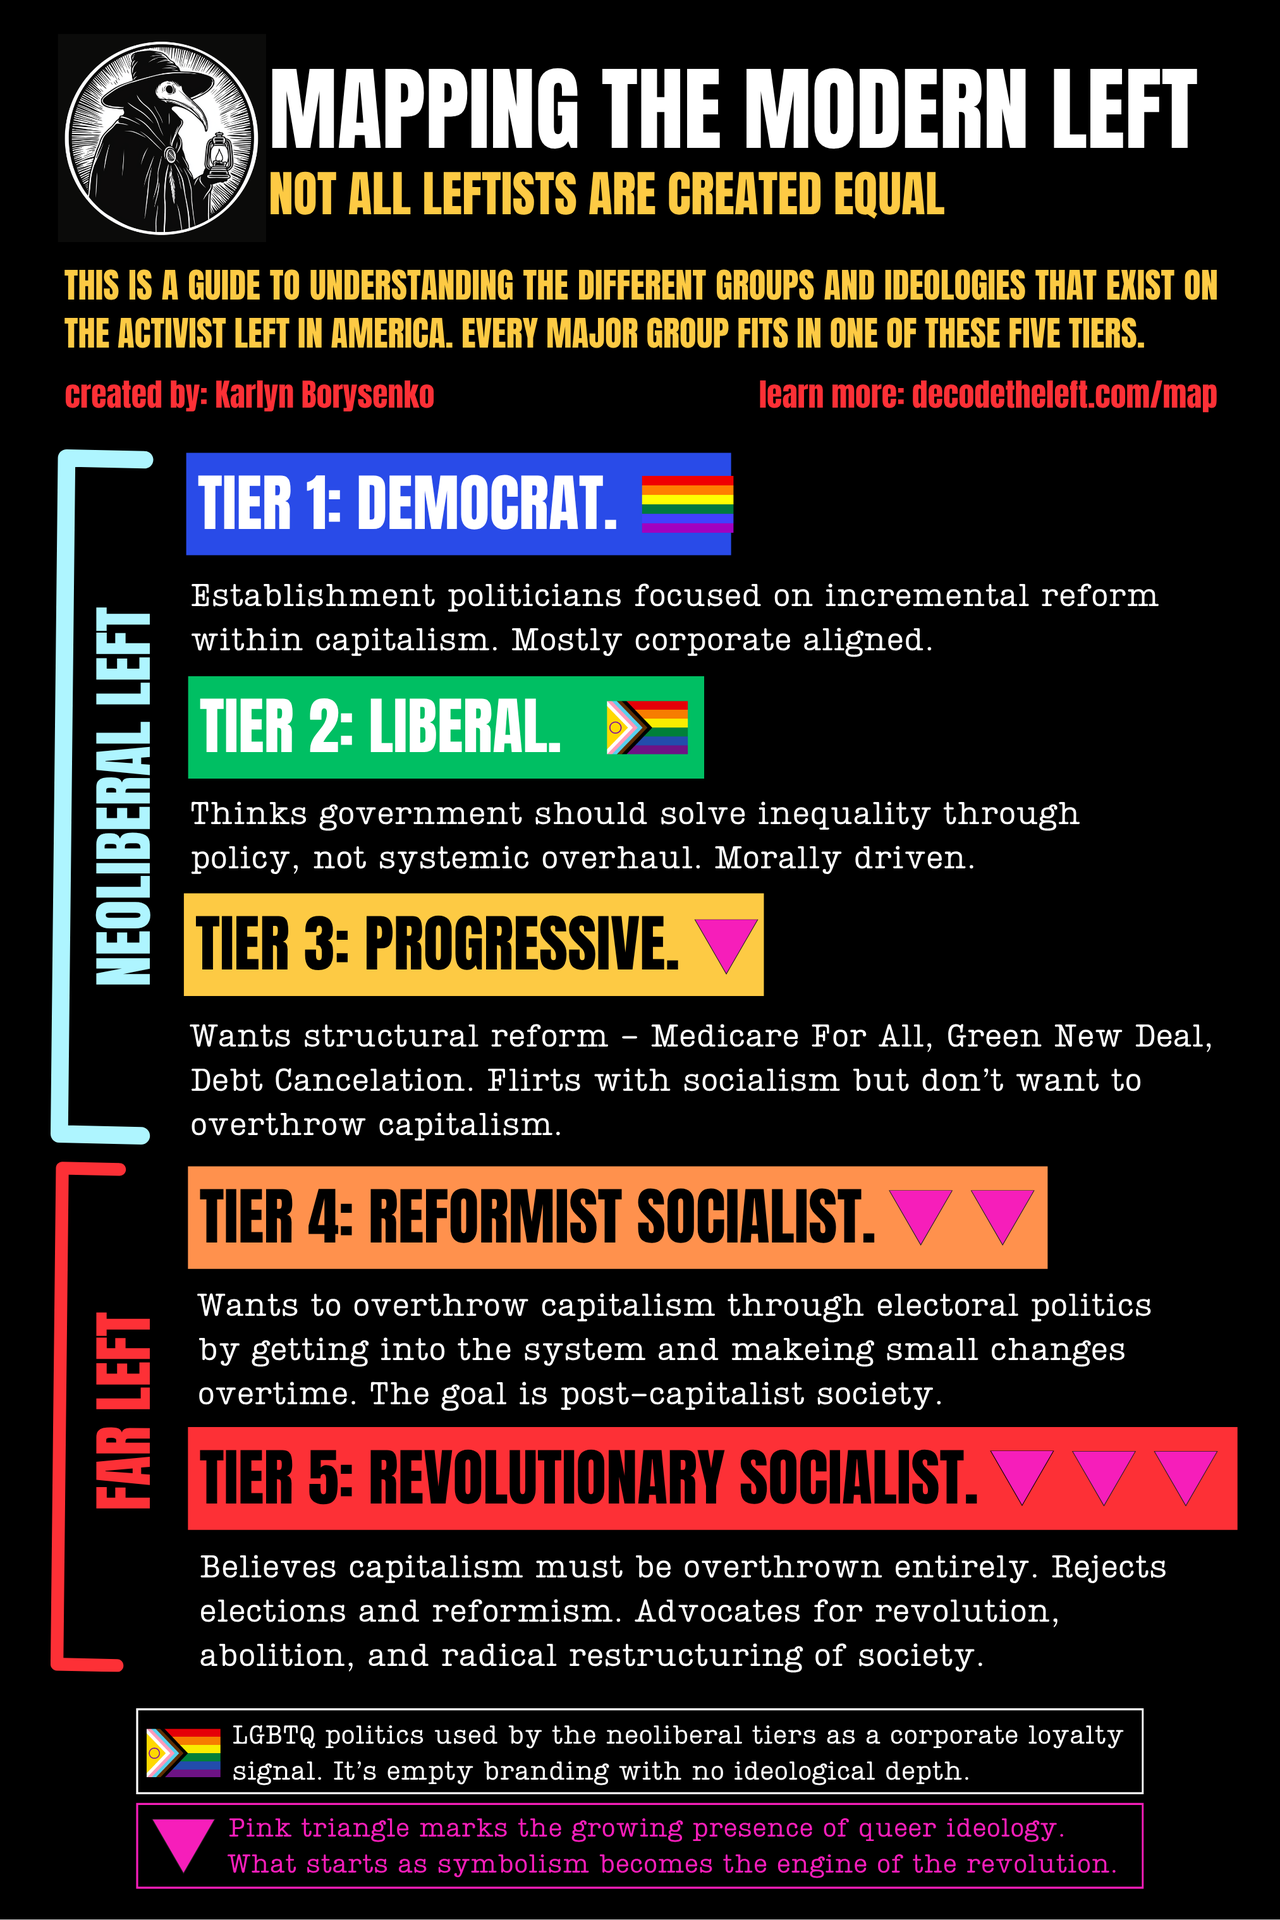
NYC Mayor Zohran Mamdani's administration has been staffed with far-left activists who seek nothing less than the destruction of capitalism and America in its current form. They govern like socialist thugs and are only in the early stages of mounting a war against NYC's wealthy.
This is particularly worrisome for the Ken Griffins of the world because Mamdani's friend, an unofficial spokesperson for the Democratic Socialists of America who has taken questionable trips to communist Cuba and may be linked to a foreign subversion network, told his followers, "Let the streets run red with their capitalist blood."
Hasan Piker calls on his followers to kill capitalists:
“Yeah kill them! KiII those motherfuckers and murder those motherfuckers in the streets. Let the streets soak in their fucking red capitalist blood, dude.”
Mamdani's Department of Finance published a new list of names and property addresses for residences it classifies as potentially unoccupied, non-primary homes valued above $1 million.
"This is a target list. And it's clearly designed to intimidate homeowners under the very realistic threat of violence from Luigi-worshipping leftist thugs," Queens City Council Member Vickie Paladino wrote on X.
I’m sorry but the city did what?
This is a target list. And it’s clearly designed to intimidate homeowners under the very realistic threat of violence from Luigi-worshipping leftist thugs.
Understand that they want people to die. As Zohran’s buddy Hasan Piker said “let the… https://t.co/Rku52dHL7D
— Hon. Vickie Paladino (@VickieforNYC) July 26, 2026
Property transaction records for NYC are public, but what the far-left controlling City Hall actually did was create a handy list of wealthy individuals and the addresses of their second homes, which "Luigi-worshipping leftist thugs" could use to target in intimidating tactics - common among the radical left.
Council Minority Leader David Carr called the release "reckless," warning that thousands of properties may have been incorrectly classified.
What readers need to understand is that the Mamdanis of the world and reform socialists are not actually focused on affordability, transgender issues, or Palestine. Those causes function as mobilization pathways toward a broader strategic objective: disrupting the gears of capitalism and creating the conditions for systemic collapse from within.
The DSA states this objective plainly:
What the internet is saying:
The "Curley effect" in action: Intentional policies designed to make the politically undesirable move out, after which it becomes easier to consolidate political power. #NYC
— OG Capitalist Shrugged (@CapitalShrugged) July 25, 2026
You know who else published lists… the Nazis. They published lists of Jewish owned businesses and properties, so the Germans knew whom to throw out and illegally take over those homes and businesses
Publishing names and addresses creates a glaring security risk: How long before a radical Marxist group targets one of these homes with a firebomb?
The central point is that reformist socialists are not primarily focused on solving affordability, for which they have produced no credible plan.
Their main objective is to delegitimize and ultimately dismantle capitalism. Mamdani's list should alarm wealthy New Yorkers because it lowers the barrier for surveillance, harassment, and potential violence by radical activists tied to the radical left. This doesn't prove an attack is imminent, but it materially expands the threat environment.
Intimidation and political violence are common tactics among the radical left. The State Department warned about the resurgence of the far left in recent weeks, underscoring that America's political climate is entering a more volatile and dangerous phase reminiscent of the era when the Weather Underground ran amok.
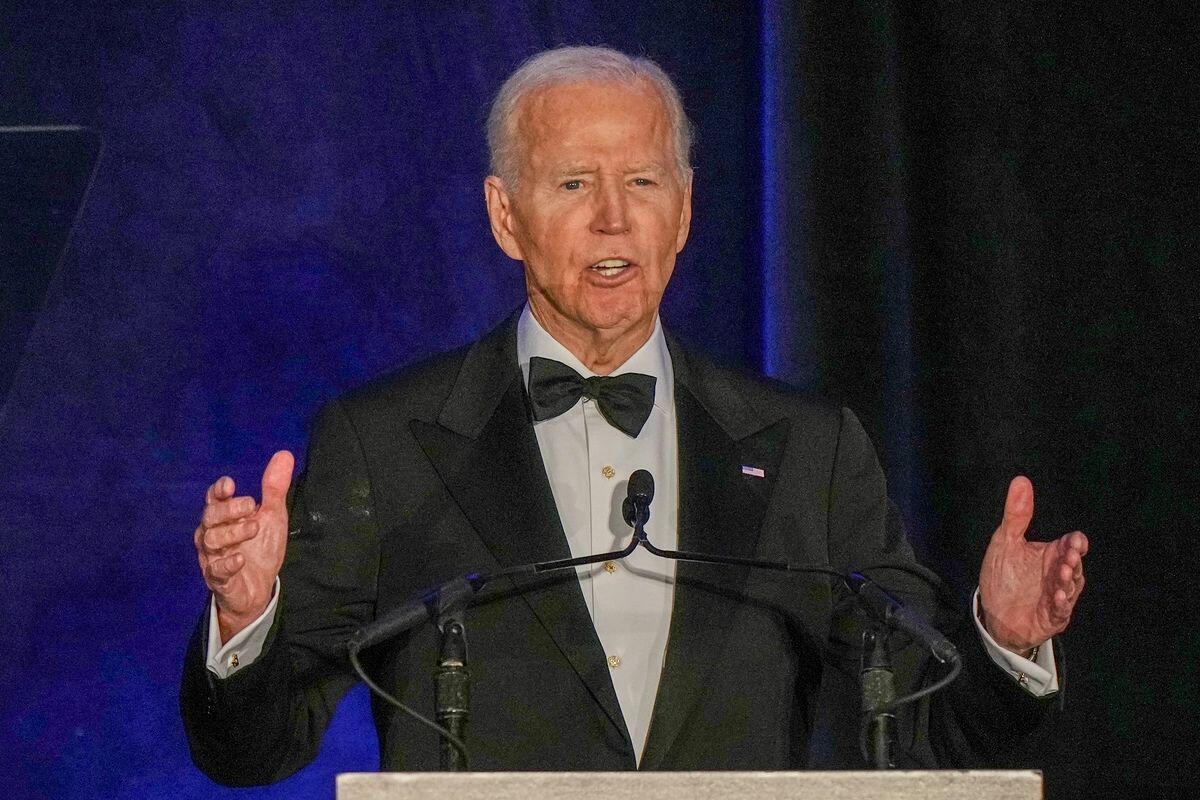
New Biden Tapes Reveal Hur's "Well-Meaning Elderly Man" Had An $8 Million Motive To Keep Classified Docs
Joe Biden kept classified material after leaving the vice presidency, knew what it was, and read it aloud to a civilian with no security clearance who was helping him write a book he was paid $8 million for. He said as much on tape, repeatedly, in 2016 and 2017. The Justice Department had those recordings and kept them from the public for two years - the same two years it was prosecuting Donald Trump for mishandling classified documents.
The recordings came out Monday night, released by the Heritage Foundation's Oversight Project after a FOIA fight that began in March 2024 and ran first against the Justice Department and then against Biden's personal attorneys. Roughly three hours of audio and 117 pages of transcripts, drawn from the interviews Special Counsel Robert Hur obtained during his investigation into Biden's handling of classified material. The Oversight Project says the complete set runs to about 70 hours and that further releases are coming.
Start with what is on them.
In an October 2016 session, recorded while he was still the sitting vice president, Biden tells ghostwriter Mark Lewis Zwonitzer: "I have extensive notes over this period of time... They didn't even know I had this."
In February 2017, a month after leaving office and living in a Virginia rental: "So this was - I, early on, in '09 - I just found all of the classified stuff downstairs." He then walks Zwonitzer through his 2009 argument against the Afghanistan troop surge.
Joe Biden: "So this was, I early on, um, in '09 I just found all the classified stuff downstairs." pic.twitter.com/lsFlaSZMhC
— House Judiciary GOP 🇺🇸🇺🇸🇺🇸 (@JudiciaryGOP) July 27, 2026
On April 14, 2017, he stops to warn the man he's talking to: "Some of this may be classified. So, be careful. I'm not sure. ... It's not marked classified, but -"
— House Judiciary GOP 🇺🇸🇺🇸🇺🇸 (@JudiciaryGOP) July 27, 2026
Elsewhere in the same period: "The next thing I have here is, um,this is classified."
Hur's report found that Biden read from classified notebooks to Zwonitzer "nearly verbatim, sometimes for an hour or more at a time" on at least three occasions, and that the evidence showed convincingly he knew those notebooks held classified information. The FBI later recovered marked classified documents on Afghanistan policy, along with the notebooks, from the garages, offices and basement den of Biden's Wilmington home.
The transcripts are shot through with redactions. The Oversight Project's argument is that the blackouts are themselves the evidence: "The silence of the redactions loudly demonstrates that Biden knowingly and willfully disclosed classified information to his ghostwriter." Nine years on, the public still isn't cleared to know what he told a man who wasn't cleared to hear it.
The Justice Department Had The Tapes The Whole Time
In June 2023, the Department of Justice indicted Donald Trump on dozens of counts for retaining classified documents at Mar-a-Lago. Espionage Act charges, a special counsel, a grand jury, federal agents inside a former president's home, and a year of argument over whether a man who kept boxes in a bathroom endangered the country.
Through every month of that, the same Department held audio of the sitting president saying he'd found all the classified stuff downstairs. It had obtained the recordings through Hur's investigation, knew their contents in detail, and declined to release them for the remainder of Biden's term.
When Biden's own interview with Hur finally surfaced in May 2025, the Department didn't relent - Axios obtained the five hours of audio and published it.
The ghostwriter tapes took another fourteen months. Once Biden left office and no longer had a department asserting exemptions on his behalf, his private attorneys sued in May 2026 to keep them sealed, arguing the conversations were personal. A federal judge in Washington ruled against him in June. A three-judge panel of the DC Circuit then rejected his appeal 2-1, finding a substantial public interest in disclosure.
He had two moves left - rehearing before the full circuit, or a petition to the Supreme Court - and took neither. His spokesman announced that Biden "respects the courts and the vital role an independent judiciary plays in a healthy democracy," in the same week he stopped resisting one.
The Ghostwriter Deleted The Recordings Before The FBI Called
The tapes came close to never existing at all. Chapter Seventeen of Hur's report deals with what Zwonitzer did after learning a special counsel had been appointed to investigate Biden. Before the FBI made contact, he deleted the audio files of his Biden interviews from his laptop and from an external hard drive. He described it to investigators plainly: "I simply took the audio files subfolder from both the G drive and my laptop and slid them into the trash. I saved all the transcripts."
Hur's own assessment of what had been destroyed was that the recordings "had significant evidentiary value."
Bureau technicians recovered most of the audio from the external drive, and nothing relevant from the laptop. Three of the recovered files were missing portions. A fourth had been partly overwritten by a different recording. Zwonitzer told investigators he'd been worried about being hacked, and declined to say how much of his motivation was the federal investigation he had just learned about. He wasn't charged - as Hur cited insufficient evidence and found him cooperative and forthright, which he was, after the deletion.
Hur Gave Two Different Answers Five Weeks Apart
In addition to pulling a Comey ('no reasonable prosecutor' vibes), Hur was quite the spin doctor.
In February 2024, Hur wrote that a jury would likely see Biden as"a sympathetic, well-meaning, elderly man with a poor memory," and that convicting a former president in his eighties of a felony requiring willfulness would be difficult. It was the only line most people retained from a 345-page report. Biden's own lawyers spent the following week attacking it as gratuitous, and it followed him into every press conference until he left the 2024 race.
Five weeks later, on March 12, 2024, Hur sat before the House Judiciary Committee under oath and was asked why Biden had taken the notebooks in the first place. His answer pointed at money. Biden had "strong motivations to ignore proper procedures for safeguarding his classified" material, Hur testified, and the likely reason he wanted the notebooks was the $8 million three-book deal he'd signed with Flatiron Books in April 2017, reported by Publishers Weekly and covering two books by Biden and one by Jill Biden.
Those two accounts describe different men. One is confused and harmless. The other is a former vice president with a financial motivation to hold onto national security material and a ghostwriter waiting to hear it.
The financial record sits in public filings. The Bidens reported adjusted gross income of $396,456 in 2016, his last full year as vice president, and $11,031,309 in 2017. Promise Me, Dad sold more than 300,000 copies, and Biden took in roughly $1.8 million from thirty book-tour appearances. When Hur's investigators later asked him about the recordings, his written answers maintained that he'd used the word "classified" only loosely around his ghostwriter.
Bottom line: Hur found evidence of disclosure - spoken aloud, to a civilian without clearance, in service of a book contract that Hur himself identified as the motive. Disclosure is what the Espionage Act was written to reach, and the man who did it was never charged, never tried, and never had to sit in a courtroom while a jury listened to the recording.
In February 2025, Trump revoked Biden's security clearances and daily intelligence briefings, citing the special counsel directly: "The Hur Report revealed that Biden suffers from 'poor memory' and, even in his 'prime,' could not be trusted with sensitive information."
Meanwhile, about 67 hours of audio have yet to be released.