
Charting 20 Years Of Home Price Changes In Every U.S. City Tyler Durden Tue, 10/27/2020 - 23:45
At the turn of the century, the average U.S. home value was $126,000. Today, that figure is at a record high $259,000 – a 106% increase in just two decades. Of course, as Visual Capitalist's Nick Routley notes, the path from A to B was anything but linear with a financial crisis, housing bubbles in major cities, and now COVID-19, which is drastically altering market dynamics.
How has the housing market evolved, on a city-by-city basis?
Two Decades of Housing Prices
The interactive visual below – created by Avison Young Global, using data from Zillow – is a comprehensive look at U.S. home price data over the past two decades.
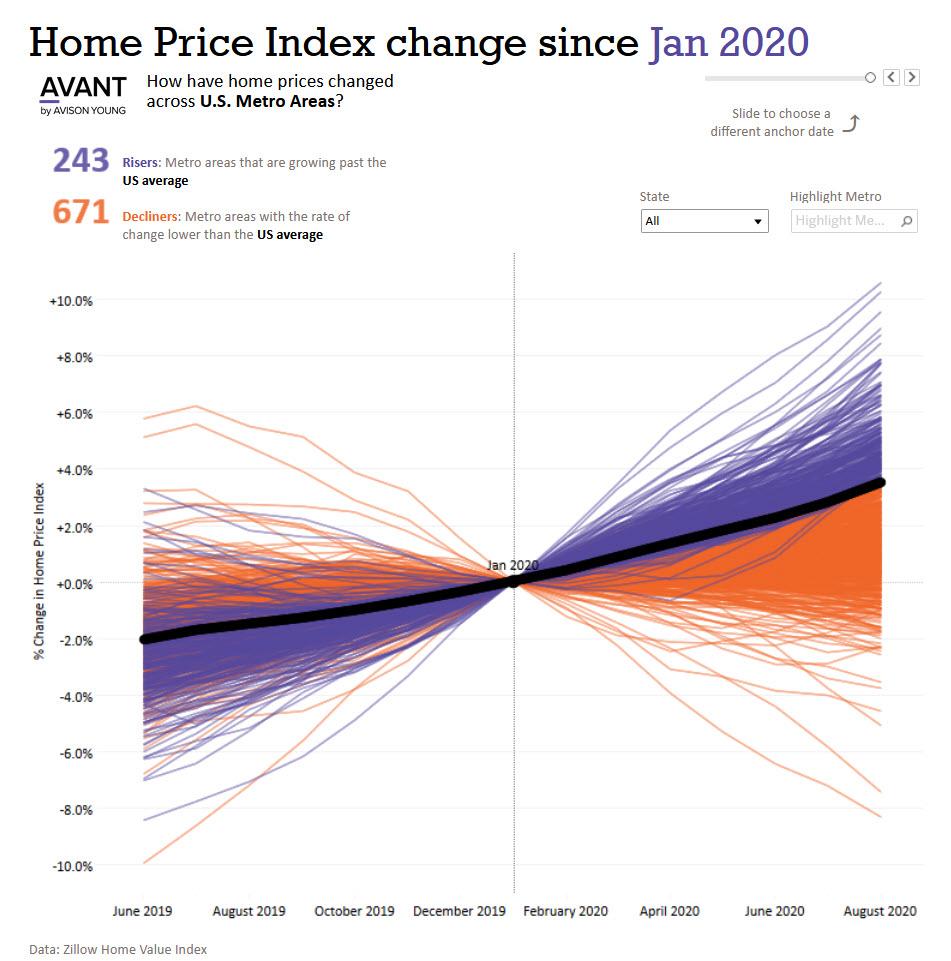
The Lay of the Land
A number of things become apparent when looking at historical data of hundreds of U.S. cities.
First, the trajectory of home prices is defined by the 2008 Financial Crisis. After prices took a steep dive, it took a full decade for the average home price to rise back up to the 2007 peak.
Next, broadly speaking, the U.S. average is being “pulled up” by the hottest regional markets. The majority of housing markets have seen between a 50% and 100% increase in price over the past 20 years. This is also true at the state level, where booming markets such as Hawaii saw price increases double the U.S. average.
Going West
The West Coast has seen dramatic home price appreciation in over the last two decades, a trend that permeated the entire region. Every single city tracked in this database beat the U.S. average.
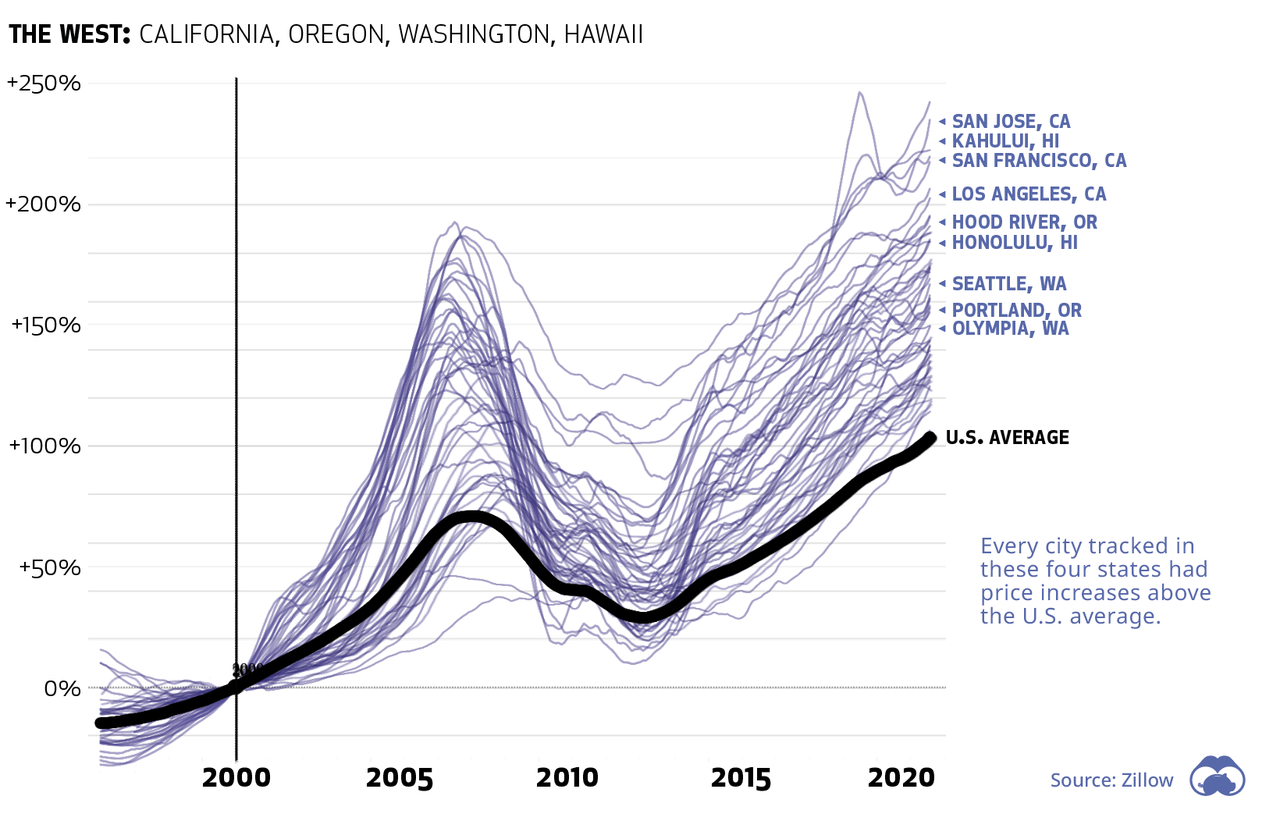
California and Hawaii saw the biggest gains, with a number of cities ending up with a 200%+ increase over prices in 2000.
The biggest gains in the entire country over the time period was Madera, California, which is located just north of Fresno. The nearby cities of San Jose and San Francisco rose by an impressive 235% and 219%, respectively. As a practical example – during the meteoric rise of Silicon Valley, average prices in San Francisco shot up from $364,000 to $1.12 million.
Even the bottom city (Yakima, Washington) on the left coast saw an increase of 114%.
Slower Home Price Changes
In general, cities located in America’s “Rust Belt” states saw slower home price growth. In fact, every city in these five states saw price growth below the U.S. average.
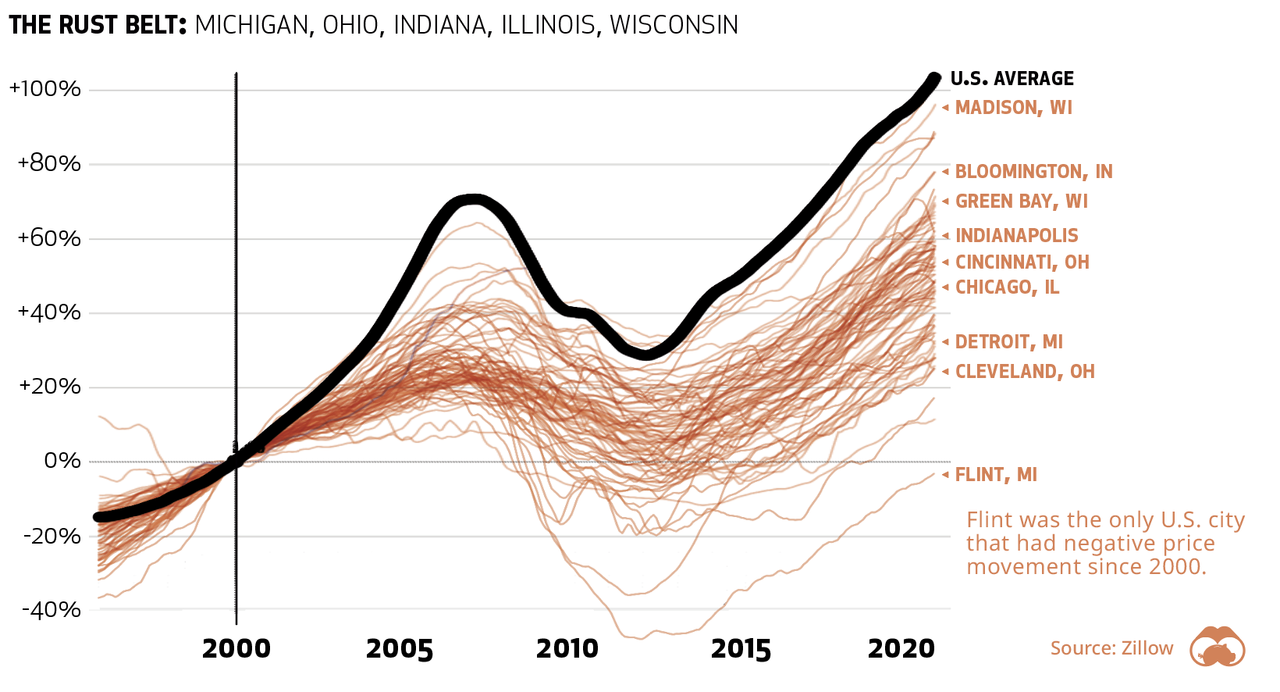
Of the top 20 U.S. metros, Detroit and Chicago saw the slowest price growth over the past two decades. Flint, Michigan, was the only city in the country to see a price decline.
At the state level, Illinois, Michigan, and Ohio were the bottom three in terms of home price appreciation.
A Useful Barometer
Looking at country or state level data fails to capture the incredible nuance of home values around the country.
That said, since the value of a primary residence makes a significant portion of wealth for most Americans, these price movements serve as a useful barometer of the health of the real estate market, and the economy as a whole.
https://ift.tt/31MMq9U
from ZeroHedge News https://ift.tt/31MMq9U
via IFTTT


0 comments
Post a Comment