
Early Indications Point To 1.5 Million Jobs Number
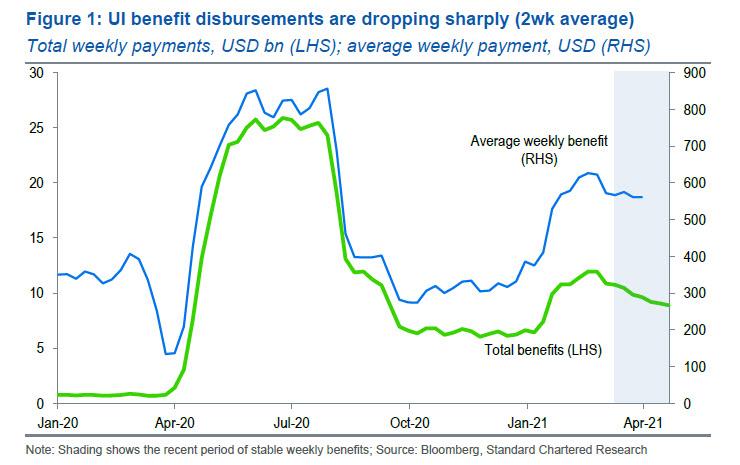
Early indications point to very strong job numbers for April (due May 7), possibly as much as 1.5 million jobs or more, according to Standard Chartered FX strategist Steve Englander. He bases this estimate on an analysis of unemployment insurance (UI) benefit payments in recent weeks. Average weekly benefits have been very stable since late February, but the amount of spending has dropped sharply since mid-March (Figure 1). By implication, the numbers receiving benefits are probably also dropping.
Englander then translates the drop in benefits to an implied fall in unemployment, and seasonally adjusts the unemployment drop based on past patterns. As a result, he finds that unemployment may have decreased between 1.4 million and 2.0 million from March to April. The wide range emerges because March to April seasonality is very strong and the adjustment factor is very uncertain. However, as he adds, a number in the middle or upper end of the range is more likely than in the bottom half, based on this analysis.
This is how Englander arrived at his estimate
- First, assume that just about everyone who lost employment is collecting unemployment benefits because of the broadening of benefits eligibility. In the past, UI benefits have covered about half of workers who lose their jobs; now they cover most of the work force potentially affected by COVID-19, including gig workers and the self-employed.
- Similarly, benefits keep getting extended and now will last to September 2021. The major reason to leave unemployment is to go back to work.
- Early in the pandemic, benefits paid and the number of benefit recipients moved erratically because of delays and slow systems. This has stabilized in recent months – the $1.9tn stimulus bill in March extended, but did not change, benefits from the $900bn December bill, so there were no discontinuities once the December provisions were implemented.
- Since early March, the average weekly payment for unemployed workers has been steady at about $560.
- The number of people receiving benefits dropped by 8.6% on a two-week moving average (2wma) basis in the three weeks after the March survey period. The amount of UI benefit payments on the same basis dropped 10.4%. The amount of UI benefits paid out in the April survey week on a 2wma was 15.6% lower than the amount of UI benefits paid out in the March survey week.
- If the percentage drop in benefits matched the percentage drop in unemployment, the numbers receiving UI benefits would have dropped 2.9 million.
- April employment seasonal effects are severe and cyclical. When unemployment is low and frictional, as in 2018 and 2019, the April seasonal decline in benefit recipients can be 16-18% of the total. This is because with so few unemployed for cyclical reasons, the ebb and flow of seasonal weather represents a big fraction of employment moves.
- When unemployment is high, as in 2010 and 2011, the decline in benefit recipients can be as low as 6-8%. Good weather doesn’t bring you back to work in a bad economy. This April, a reasonable range for the seasonal decline is no more than 8%, and could be as low as 5%, given how much stronger cyclical factors are relative to weather in the current downturn than was the case in 2010 and 2011.
- A 5% seasonal unemployment drop would leave unemployment 2.0mn lower on a seasonally adjusted basis; an 8% drop would leave unemployment 1.4mn lower. The bigger unemployment drop looks more reasonable to us because there is not that much seasonality in services and retail, which were heaviest hit.
Risks and data biases
In some ways these data are better than the BLS surveys that generate household and payroll employment estimates. The Treasury publishes its disbursements on UI benefits on a daily basis with only a day’s lag; these data are not a sample but the totality of what is getting paid. Similarly, the insured UI data basically represent the universe of people receiving benefits and the COVID-19 relief measures encompass a very high percentage of those who have lost jobs, so sampling issues are modest.
If the objective is to predict non-farm or household employment, the independence of the Bureau of Labor Statistics surveys from the Treasury spending and Department of Labor benefits data is a disadvantage because the samples may diverge, even if sampling is less of an issue.
Estimating the seasonal factor is the other big risk. In stable periods, seasonal adjustment is largely formulaic; in volatile periods, there is considerable discretion on what is viewed as seasonal. The seasonality in a period of cyclical upheaval is likely to be modest, but there is a wide confidence interval around our estimates.
Some workers can collect benefits for partial work weeks. They would be counted as UI beneficiaries, but the BLS labor survey definition classifies them as working, so the decline in benefits may be higher than the decline in BLS-measured unemployment. On the other side, newcomers to the labor market may not be receiving benefits, so if they found jobs they would count as newly employed without having previously been counted as receiving benefits.
https://ift.tt/3aJGgMu
from ZeroHedge News https://ift.tt/3aJGgMu
via IFTTT


0 comments
Post a Comment