
Ahead Of The February 2 "Fireworks", Goldman Spots A "Phenomenon That Has Never Before Occured"
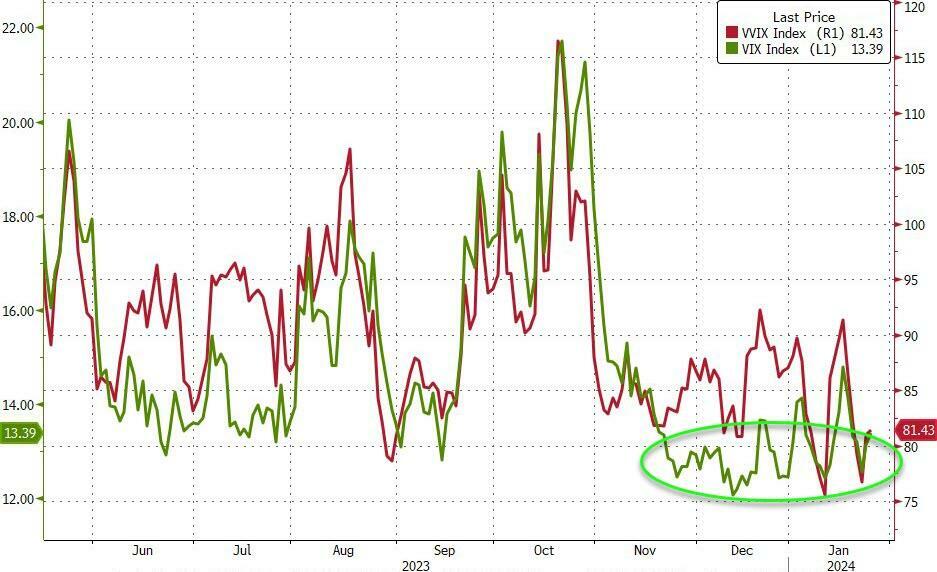
Echoing the observations from Nomura's Charlie McElligott, who warned that as we head into the "largest event-risk" week in recent memory, volatility is extremely mispriced due to a (mostly retail) army of volatility sellers who have successfully slammed both VIX and VIXX to precarious levels...
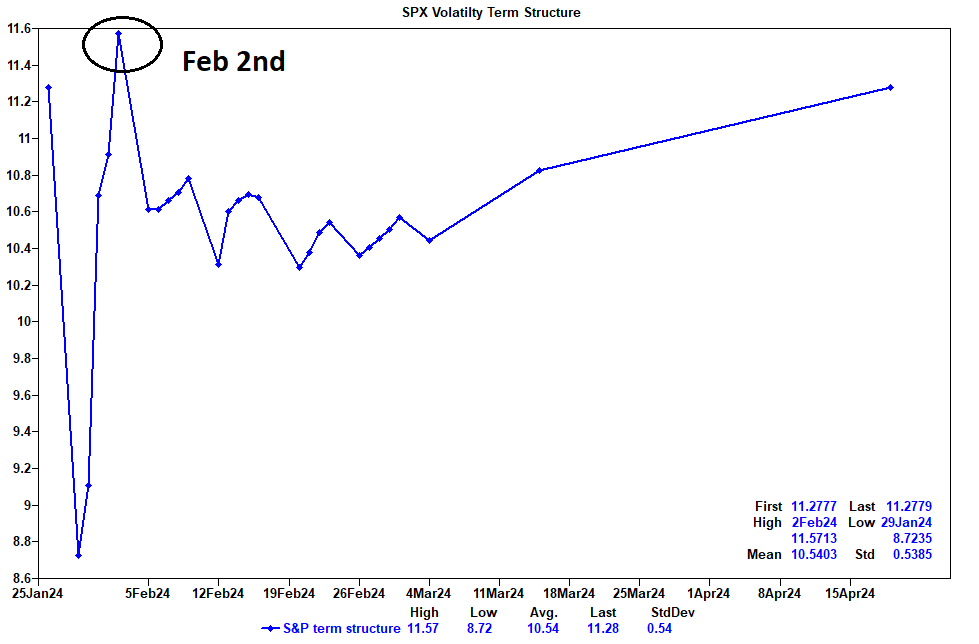
... Goldman trader Lee Coppersmith joins the bandwagon of warnings about potential fireworks next week, and writes that the US market will pay close attention to what happens between now and Feb 2nd, where among other catalysts, we get:
- More timely and accurate PCE data tomorrow
- QRA
- FOMC
- Earnings - nearly 40% of the S&P’s market cap reports, the biggest week of earnings.
Not surprisingly (especially to those who read the McElligott piece), the equity vol market is now pricing the biggest premium on this date, the S&P implied move from now thru next Friday’s close is just about 1.50%
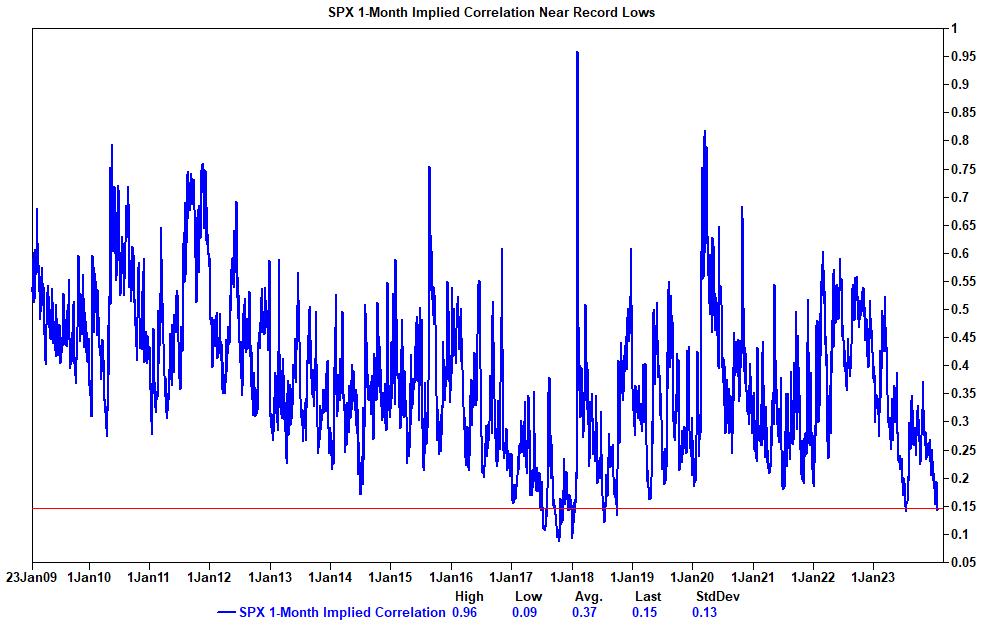
If that sounds low, it’s because it is: that's because as Coppersmith notes, "the options market is currently implying near record-low correlation amongst S&P constituents, as high gross leverage and index vol selling products have led to much more dispersion."
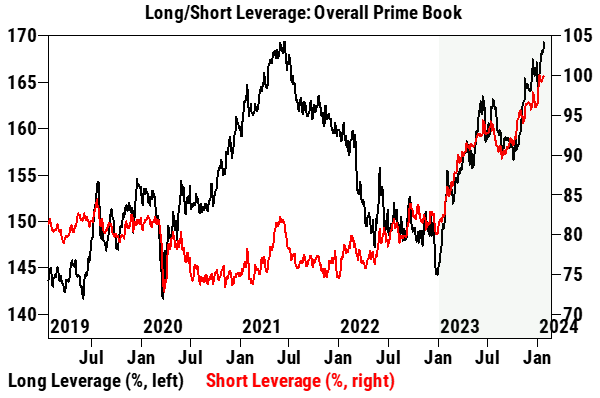
Meanwhile, as the latest data from Goldman's Prime Brokerage reveals, total gross leverage across the hedge fund community has risen to new record high levels while overall net leverage ratio is now in the 50th percentile on a 3-year lookback (vs. only 3rd percentile at the start of November).
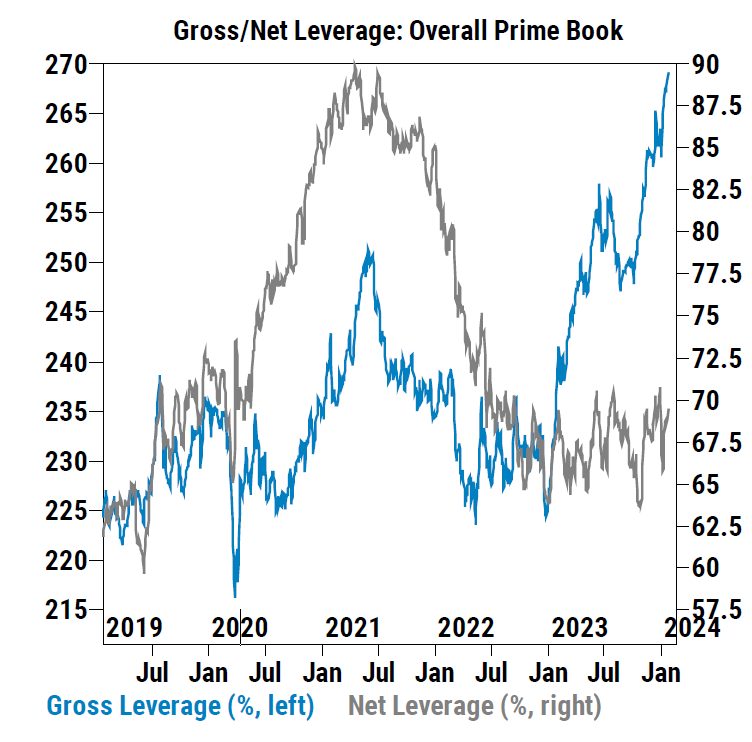
Underscoring just how precariously the market is positioned, and the potential for micro volatility, is that both long and short exposures have risen sharply to their respective multi-year highs.
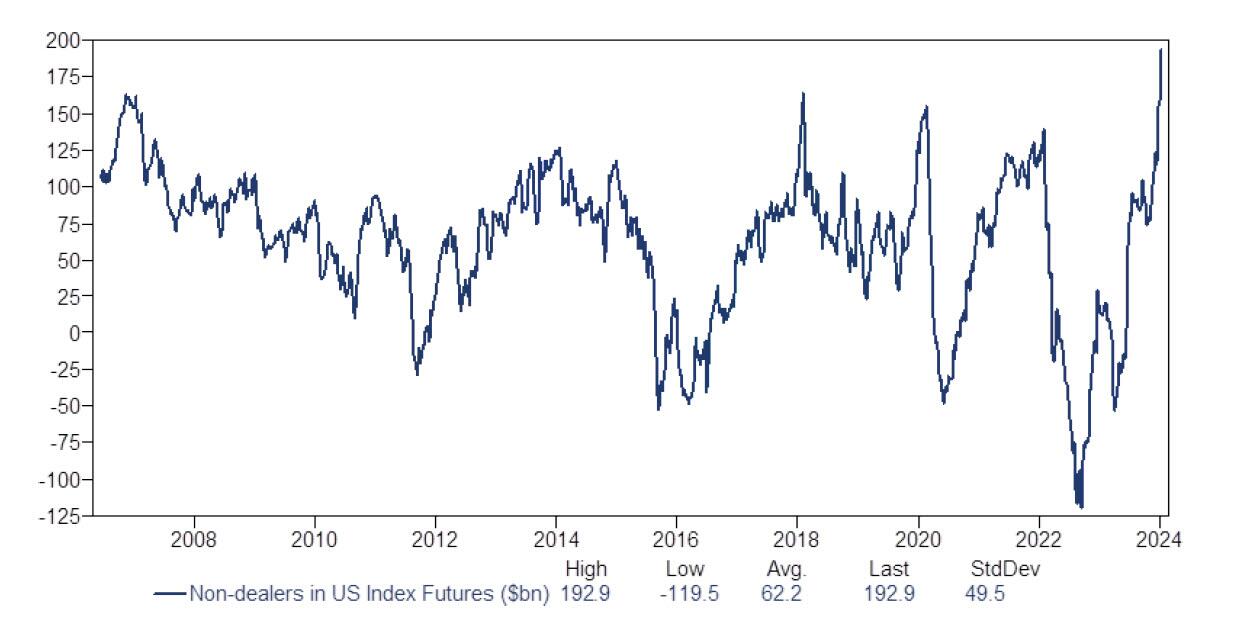
Meanwhile, length in US equity futures has never been greater! This captures institutional, hedge fund, other and smaller positions, with the driver of the long length being institutional longs against bank-dealer shorts. The non-dealer net length stands at $193bn as of 9-Jan, surpassing the highs of previous years by $30bn or more and vs. a $62bn historical average.
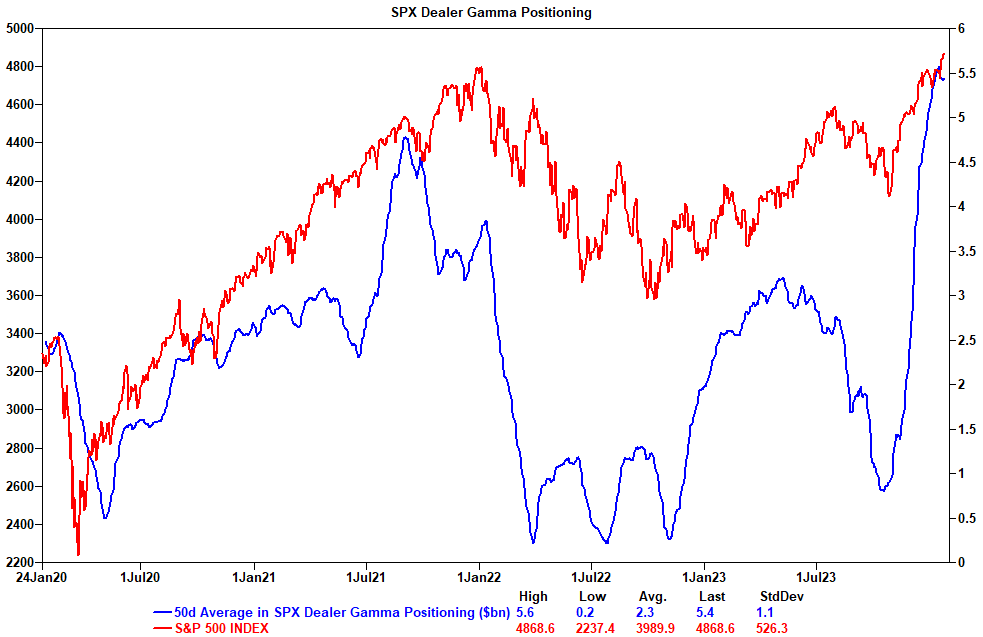
Not surprisingly, amid low volumes and with stocks hitting record highs for five days in a row, the other prevalent trend of more options selling remains thematic at the S&P index level, which continues to provide dealers with more gamma (this has a braking effect on the SPX market moves, as dealer hedging flows lead to more buying on dips, and more selling on rallies).
So where does Goldman's desk think we can move?
First, they still like Russell upside despite the recent pullback. With short exposure at multi-year highs and looming catalysts, the case for owning calls here is attractive. If tomorrow’s PCE data again confirms a disinflationary trend, some investors will be hard-pressed to still be carrying high levels of short exposure into next week’s remaining events after the striking Russell move we saw in Nov/Dec.
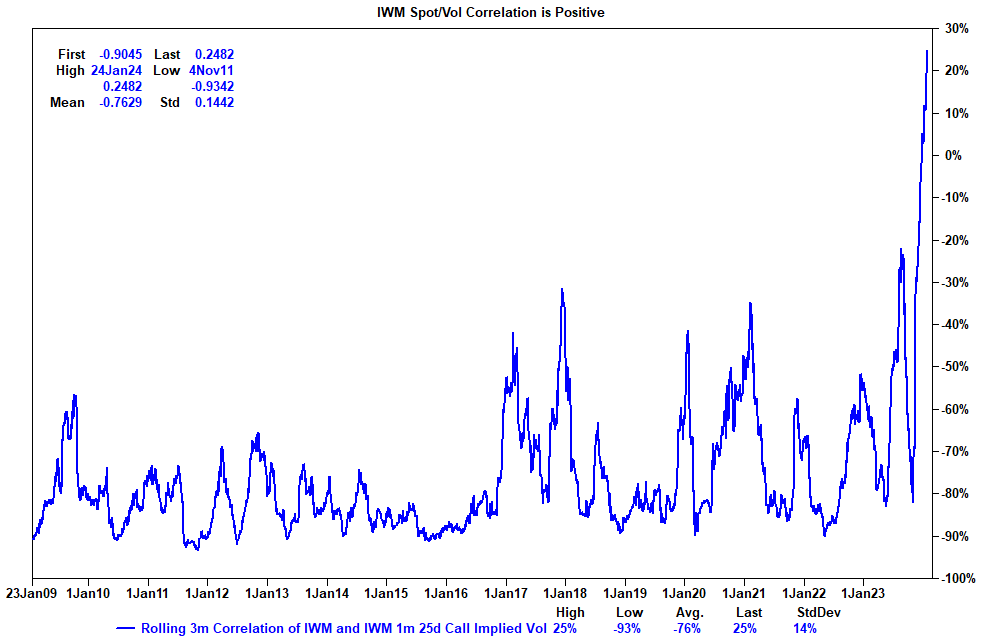
Similar to other short proxies (namely China equities, which we believe are now oversold), Goldman traders have also observed a very rare positive spot/vol correlation in IWM as investors rush to hedge shorts on rallies. This phenomenon has never before occurred in small-caps!
As a reminder, in his recent speech Fed’s Waller highlighted how important tomorrow's PCE can be:
“I like to look at the 3- and 6-month [core PCE] measures to have a better understanding of the current level of inflation… the 6-month change has been hovering close to a 2 percent annual rate, as has the 3-month measure.” - link
Enter GS Economist David Mericle:
On the timing of the first cut, Waller and Williams both seemed to raise the inflation threshold for the first cut relative to official FOMC communication, but even their higher thresholds are still met—after all, their 6-month annualized rate of core PCE inflation is below 2%. That’s why we’ve kept our March baseline—we are well ahead of schedule on bringing down inflation, so if Powell feels like they’re going to do it eventually and might as well do it sooner rather than later to minimize any downside risks, then the inflation data certainly support the case. .
As another reminder, while today’s in line PCE reading was a quarterly average for Q4 (and likely de-risks tomorrow a good amount), tomorrow we’ll specifically get the December data, where we can focus more on the sequential pace.
Where else could shorts be vulnerable?
Managers have continued to sell and press shorts in Energy stocks (which may explain today's furious meltup in the energy sector) – Goldman's PB data has shown consistent selling here to start the year as part of the re-grossing theme, and with China potentially turning a corner on the policy front, Goldman is seeing some investors warming up to this space again.
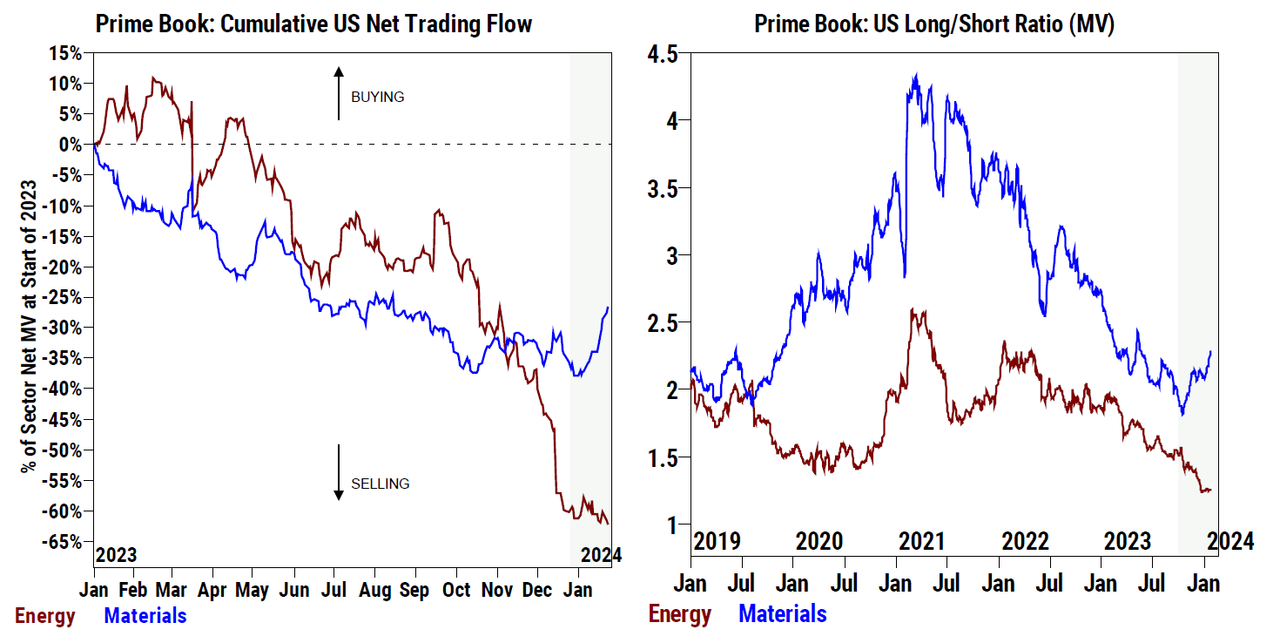
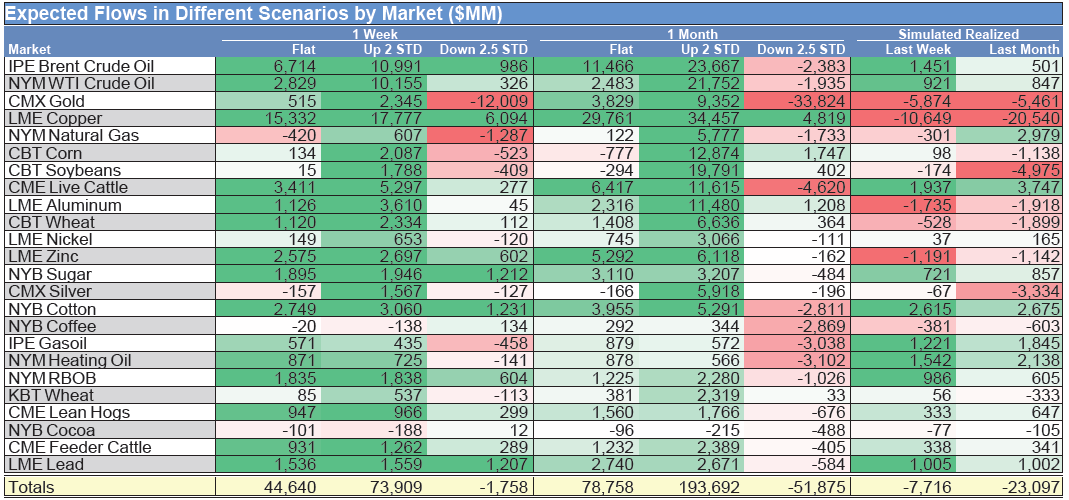
It’s also worth noting that thanks to China, commodities in general are starting to see some positive flow signals. Unlike Goldman's equity CTA model that shows a downside asymmetry and selling in every scenario, in the commodities space CTAs are poised to buy pretty much no matter what.
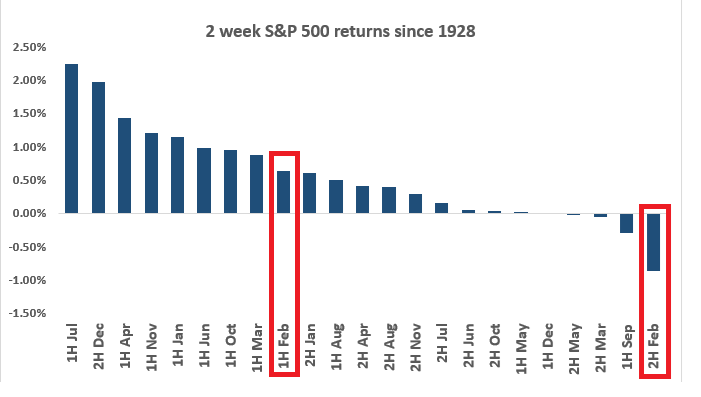
And speaking of upcoming fireworks, one last point: as shown in the chart below, there is a stunning dichotomy between the first half of February and the second half from a seasonal perspective. For those worried about any froth in the US markets, the last two weeks in February are historically the worst 2 weeks of the year, and when the froth tends to boil over. Given how well markets followed the historical analog last year, it’s something to have on the radar.
More in the full report available to professional subs.
https://ift.tt/FnHRw8a
from ZeroHedge News https://ift.tt/FnHRw8a
via IFTTT


0 comments
Post a Comment