
Grains Cheatsheet, Part 3: The Corn And Soybean Spread
The final, part 3 out of 3 in a weekly miniseries, by Macro Ops Substack, Part 1 can be found here; Part 2 can be found here.
The Corn and Soybean Spread
Corn and Soybeans compete for the same acreages area. Ultimately farmers must decide how much of their space they are going commit to plant Corn, and therefore how much Soybean they will put into the ground.
The ratio is Soybeans over Corn, and it tracks how much money a farmer receives for their Soybean crop relative to their Corn crop.
It’s usually around 2/1. Whenever it’s over 3/1, it means that it pays more to grow Soybeans over Corn. For every ton of Soybeans a producer sells he will have to sell at least 3 tons of Corn to get the same amount of income.
It’s important to realize that corn yields are bigger than soybean yields. That means that an acreage of Corn gives more bushels than an acreage of Soybeans. Since farmland is a limited resource that can’t be quickly scaled up or down, it’s important to pay attention to this indicator.
It gives you an insight on how the producers could decide to plant for the year.
Weather Is THE Real Risk Factor, it doesn’t have to materialize… the rumor is enough.
For Macro Ops narratives are important. And it’s no different for grain markets. The concept of Weather Premium is an important one to understand in order to trade grains. Whenever the crops are on the ground, they are really sensitive to bad weather conditions. Volatility tends to go up.
If you add a rumor about bad weather that COULD have a negative impact on yields, prices will go up. This higher price is known as Weather Risk Premium. The reason being is that now there are concerns that supply won’t be enough for everybody.
Some key players absolutely need corn for their operations. They are price acceptant which means that no matter the price they have to purchase the corn.
This type of player is willing to buy at a higher price just to secure its operative needs (think of Kellogg’s for example).
This type of behavior is what brings prices up.
Now, if we fast-forward to harvest time, and the Weather wasn’t as bad as previously thought. (The genetically modified seeds are pretty resilient by the way.) Then prices should go lower as the weather premium is no longer baked in anymore.
The point to take home here is bad weather didn’t become a reality, nevertheless the rumor was enough to make some key players take action, and this ended up influencing prices. So, pay attention to Weather Narratives and try to identify when you are in a Weather Risk Premium Market.
Weather has an asymmetric effect.
The real reason why markets are willing to pay a Premium for weather risk is because weather has an asymmetric effect on yields and therefore on the supply. Bad weather has the potential to literally destroy a year’s crop potential (that’s why insurance for farmers exists).
There are many ways horrible weather conditions could mess up crops. If it's too dry or too wet while the grains are in the ground it has a negative effect on yields. Too much rain when it's planting season means a slower planting pace. There’s a critical window of opportunity for planting corn and soybeans. If they are not planted in the right moment yields will suffer.
On the other hand, during harvest season if there is too much rain it also slows the pace and could lead to quality issues. Grains must have a standard dryness otherwise they are considered lower quality.
A storm could mess up piers and ships and create distribution worries. In South America where infrastructure isn’t so great, heavy rains imply bad muddy roads which makes some farms impossible to reach.
Good weather on the other hand, doesn’t have the same effect… it just helps yields to some degree, but only if everything else was done properly, and that's pretty much it.
If you are trading Soybeans, China’s New Year Holidays matter.
Check your calendar around February. China's holiday celebration lasts a week. That means that all physical operations for Soybeans stops during this time of the year, If there aren’t any other relevant news on the market like a weather story, prices tend to go down as a result of the lesser demand while the East is asleep.
By the same logic, when the festivities are over they tend to come back with a buying frenzy so it's good to be aware of this behavior.
It’s easy to pinpoint this trend in China's Soybean Imports report. February tends to be the smallest month of all.
Commitment of Trader Reports though a lagging indicator is an important one.
The COT is a really useful indicator to understand the structure of the market you’re in. It divides all market players into 3 key classifications, Commercials, Managed Money and Speculators. Commercials will be guys like ADM, Cargill, or Kellogg’s. They use the futures market not to speculate but to hedge out the risk that commodities prices have on their physical operations.
Managed Money will be hedge funds with big amounts of money. They are the so called “Smart Money.” Speculators are all the small players like you and me.
If you take each group’s long contracts minus their short contracts you will be able to pinpoint whether they are Net long or Net short.
Commercials tend to be net short almost all the time.
Managed Money can be both net short or net long. If they switch positions from a very net short position, like 150.000 contracts, to net long 50.000 contracts this should tell you that the “smart money” is now bullish on that commodity and betting on higher prices.
Referencing how long or how short the funds and the commercials are relative to their previous positions gives tremendous insight on the market.
Speculators have a tendency to be on the wrong side of the trade consistently, OUCH! (Don’t be one of them).
Unlike other bigger markets. Fund money is big enough to move prices on the grains futures market. It’s important to track their actions. A good way to keep an eye on their activities is to take their net position and divide that by the open interest.
The Open Interest
Open Interest is an indicator that confuses a lot of stock traders since it’s exclusive to derivative markets.
Here’s a simple example:
If you go long 5 contracts of Corn, you have raised the volume indicator by 5 contracts. If by the end of the day you decided to take profits and close 2 contracts, you will have to sell two corn futures.
The volume will end up being 7 contracts for the day.
But since you closed out two contracts you are only left with 3 contracts overnight. The open interest indicator will show 3 contracts.
Open Interest tracks how many futures are still open at the end of the day. Every time you short or go long on a futures contract you will add one point to Open Interest. You will “create” one contract. When you offset the position by making a closing trade, you will eliminate the contract thus reducing the OI.
The higher the OI the more contracts are created. Therefore more people are trading that particular futures contract.
If OI starts to trend lower it usually means traders are starting to roll their exposure over to the next month’s contract. Liquidity will dry up in the expiring contract and flow into the new contract.
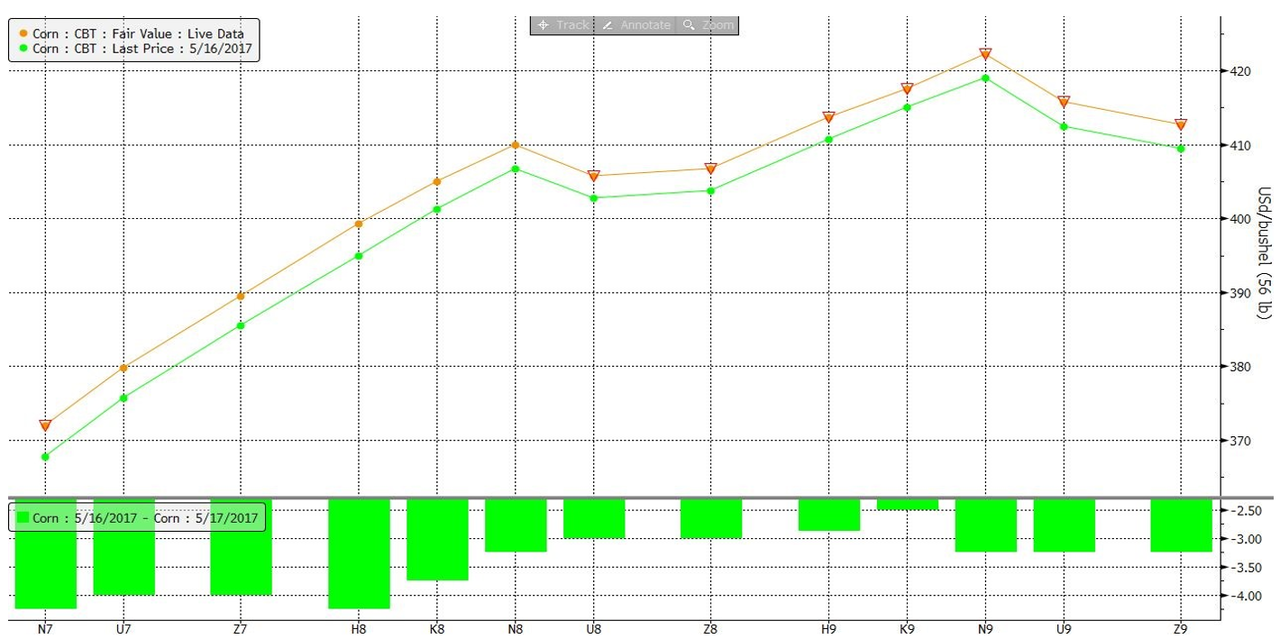
The Forward Curve: Contango and Backwardation
The forward curve is simply the chart representation of all the tradable futures contracts in any point in time. Futures contracts are available in most months. The forward curve will plot all the prices on Y axis, thus giving you a picture on how the market is pricing the contracts from today until many months into the future.
In this example prices went up from yesterday. The spread between different contracts remains the same, because otherwise there’ll be arbitrage opportunities.
When the front month is the cheapest one, and contracts further out in time are higher in price, you are in a Contango Market.
When the front month is the most expensive one, and contracts further out in time are lower in price, you are in a Backwardation market.
Calendar Spreads and the Grain Elevators Business
A calendar spread is a trading strategy which consists of profiting from a movement in price on the same underlying asset with two different expiry dates.
When we were discussing the Corn to Soybeans ratio, we were trying to get into a farmer’s head and play the game just like he would.
Whenever you are talking about calendar spreads we are entering in the domains of the Grain Elevators. Their business focuses on this.
They receive the grain from the farmers when it is abundant and cheap, store it, and then sell it when it’s scarce and expensive. They didn’t add value, they just keep it in the same conditions they received it. The idea is only to profit later on when prices are higher.
When you are trading calendar spreads you are working in a similar fashion. All you are saying is that the prices of Corn in May should go higher relative to the Corn in September or vice-versa.
Forward Curve and the Storage Theory
It always intrigued me how the market could figure out how to price Corn futures so many months in advance, especially when nobody knows how future events will unveil. To understand why the Corn market is usually in Contango we are going to need two additional concepts: Storage costs and Arbitrage.
Let’s say today’s Corn is priced at 350 cents per bushel and the futures with delivery 3 months from now are trading at 400 cents. If someone is able to buy the corn today at $3.50 and store it with a cost of 5 cents per month, he will end up with a price of 3.50+0.15= 3.65 per bushel three months into the future.
So what this opportunist needs to do is to buy the Corn at today’s prices, sell the 3 month futures contract for 4.00 and wait three months. At the end of it, he will end up with a profit 0.35 (4.00 – 3.65= 0.35) per bushel.
The point here is that there wasn’t any risk, no matter what happens to prices he’ll end up with a profit. That’s an Arbitrage trade.
If the contango curve is too steep it means that prices are too high between one contract and the next forward. Many people will be able to do a similar arbitrage trade like the one we just described. This brings down the prices on the further out futures until the arbitrage disappears.
I like to think about the forward curve in this way. If the Sep Contract is trading at 350 and the December Contract is trading at 355, then it probably costs 5 cents to store that corn from September to December. Otherwise there will be an Arbitrage Opportunity. It’s important to get a feeling of how steep the forward curve should be. If it gets too high maybe there's an opportunity!
Backwardation Case
When prices are in Backwardation it’s not possible to do the same arbitrage trade we just described.
When prices are at backwardation it usually implies that there are supply concerns and people need their grain NOW.
But if the prices of the closest futures get too high, people just will stop buying altogether. They will postpone their purchase plan and try to take advantages of cheaper prices in the future.
This two cases should give you an idea on how the market is able to maintain a reasonable Forward Curve. Of course new information could mess up with these relationships, and that is where opportunities arrive!
https://ift.tt/5ketTD2
from ZeroHedge News https://ift.tt/5ketTD2
via IFTTT


0 comments
Post a Comment