
What's Behind The Explosion In 0DTE Option Trading
In recent weeks there has been much discussion of the unprecedented explosion in 0DTE (0-days to expiry), or options with less than 24 hours to maturity, which have become an extremely levered way to bet on even the smallest market gyrations (of course, the past month has seen some very major market gyrations, so imagine those magnified by 100x or more when it comes to P&L impact).
Just last week we quoted Goldman's derivative strategist Rocky Fishman explaining that "the strongest area of volume growth has been ultra-short-dated" options, and that "measured in notional volume terms, S&P options with less than 24 hours to maturity now represent 44% of the index’s trading volume, and have been averaging $470BN notional per day over the past month."

Roughly around the same time, JPMorgan quant Peng Cheng also picked up on this fascinating topic, writing that the increase in the volume of 0 day to expiry (0DTE) options on the S&P 500 (SPX) has attracted a lot of questions.
To analyze the topic, he published two reports (both available to pro subs), the first of which focused on 0DTE SPX index options and found that 1) the flow is not retail driven; 2) the order flow is biased towards seller initiated; and 3) proposed a framework is proposed for measuring the market impacts of 0D options. The second report looked at the tradability of 0D options.
Let's start at the top with Peng's response to several client questions:
Q1: Are retail traders driving up the volume?
Based on JPM's retail classification algorithm, around 5.6% of all market volume on 0DTE options is attributable to retail market orders. This may be higher than the average for all SPX options (3.3%), but far from dominating the flow.
According to Peng, it is tempting to overestimate the retail activity in 0DTE options, given one observes a large number of small trades in 0DTE options. However, due to the proliferation of algo trading, trade size is no longer a good classifier for retail vs. institutional. Moreover, the average 0DTE trade size is not smaller than regular options, for the most part. To illustrate, the average trade size of 0DTE options is 3.6 contracts vs 5.7, for all SPX options. However, as Figure 2 shows, the distributions of 0DTE and regular option trade sizes are largely indistinguishable besides the very right tail (largest trades).

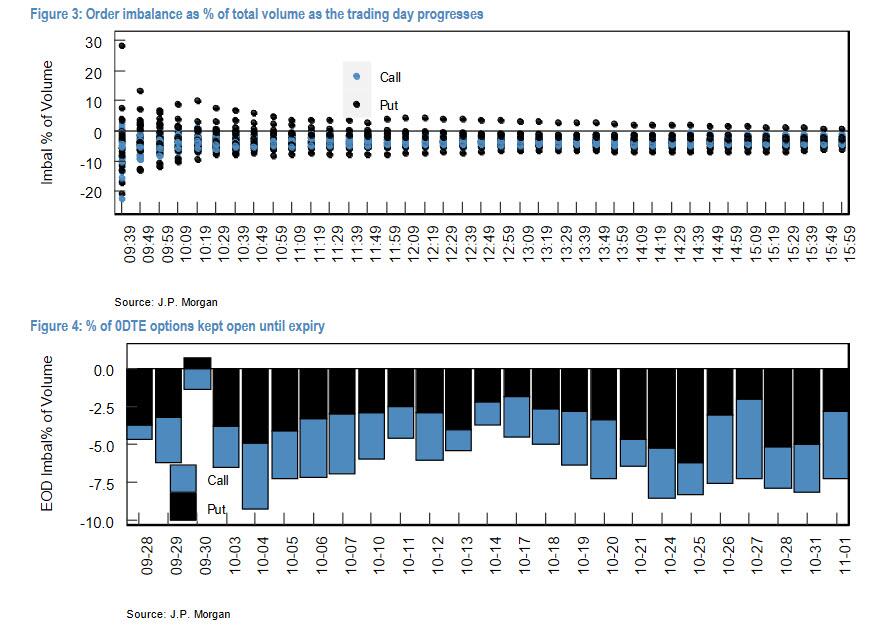
Q2: Are these options bought or sold, and are they held to maturity?
After estimating the directions of all +trades on 0DTE options, Peng does not observe an overwhelming bias toward either buying or selling. Despite the large volume traded, only a small percentage of the trades result in imbalances, and most of them are in fact net sold. Moreover, JPM estimates that only around 6% of the options are kept open until maturity.
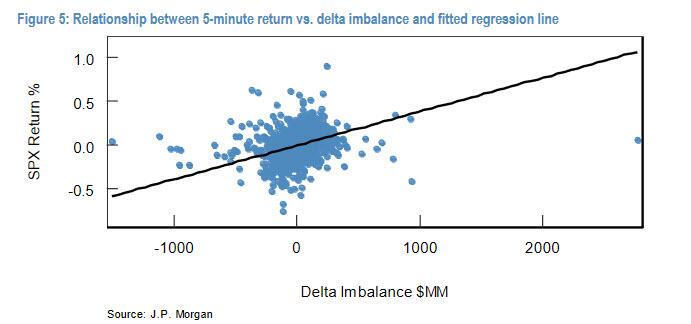
Q3: Do 0DTE option trades move markets?
Since 0DTE options are traded at such a high frequency, their delta hedging behavior becomes much less predictable. Therefore, the gamma on 0DTE options is less meaningful than gamma on longer dated options. Instead, the JPM strategist looks at the market impact of delta: he partitioned market trading hours (9:30AM – 4:00PM) into 5-minute intervals. All 0DTE option trades are assigned an estimated trade direction, and their deltas at trade initiation are aggregated into the 5-minute bars. These aggregated deltas are then merged with the S&P 500 returns over the same interval. A regression between these two quantities tells us the market impacts emanating from 0DTE option delta imbalance. The relationship can be seen in Figure 5, whose positive slope suggests that there is indeed some market impact on the SPX from 0DTE delta. To wit, JPM estimates that market impact in any 5 minutes is between [-0.6%, +1.1%] over the last month.
With that background in mind, Cheng next looks at a transaction cost analysis and profitability of trading 0DTEs.
Transaction cost analysis
Q4. Is it more expensive to trade 0D options than longer-dated options, and if so, by how much?
Using tick level data during regular trading sessions from the month of October, JPM measured the cost of trading at-the-money 0D options. Specifically, it filtered for options with |delta| between [0.45, 0.55] at trade inception and eliminated those that are traded exactly at the mid. For comparison, we run the same analysis on 1 day to expiry options. The chart below shows the average effective spread, defined as the difference between traded level and mid, by trade size. For trades that are 10 contracts or fewer, the transaction costs are relatively invariant with respect to size. However, the transaction cost for 0D options is 3 times as much as 1D options on these trades.
![]()
Specifically, for 0D options, the volume-weighted effective spread is approximately 0.35 vega for trades 10 contracts or fewer (95% of all trades). For the 5% largest trades, the effective spread is 0.65 vega. In comparison, for 1D options, the average effective spread of is only about 0.11 vega for the lower 95% of all trades (11 contracts or less), and 0.66 vega for the 5% largest trades.
In terms of the intraday profile, there is significant volatility in the 0D option effective spread throughout the day. Notable volatility is observed at the market open, and again after 15:00 as time to expiry approaches 0. The profile of 1D options is much better behaved and exhibits little intraday seasonality.

Profitability
As pointed out in Q2 above, most of the 0D options are net sold by end users. This begs the question, who are the end users, and how are they using these options? In our view, these options are likely to be used by high-frequency directional traders, rather than volatility arbitrage traders. This is based on our analysis below, for which we find outright option returns to be profitable, but volatility premium strategies to be unprofitable.
First, consider the outright performance of the end users of 0D options, who are assumed to pay the bid-ask spread to enter into these trades. Let's limit the analysis to ATM options (|delta| between 0.45 and 0.55 at the time of trade). Figure 4 shows the performance of estimated P&L shortly after trade initiation, based on the best bid or offer of the traded option 1 and 10 minutes later. These trade level P&Ls are then aggregated into a daily volume weighted average. It's notable that not only is the performance strong, but also that 2/3 of the 10-minute P&L is earned in the first minute. Moreover, profitability disappears if these trades are held to expiry. It further supports the hypothesis that 0D options are unlikely to be held to expiry.
On the flip side, assume the market makers supply liquidity to the order flow and hedge out delta, their estimated P&L is 1 and 10 minutes after trade initiation is shown in Figure 5. They also show a strong performance, implying that volatility premium is captured by taking on the opposite positions of the order flow. The difference between delta hedged and unhedged performance suggests that end users of 0D options are unlikely to be volatility arbitrage traders.

In summary, JPM finds that trading 0DTE options cost up to three times as much as trading 1D options. However, it appears that the end users of 0D options profit from directional, high-frequency trading strategies even after incorporating the wider bid-ask spread. In other words, in a time when conventional HFT frontrunning of orderflow is far less profitable than it was a decade ago, HFTs are forced to resort to such market reflexivity schemes as 0DTE to boost their returns. At the same time, market makers are willing to supply liquidity thanks to the wider bid-ask and are able to systematically profit from delta hedged positions.
More in the full 0DTE notes available to pro subs.
https://ift.tt/lxgNPaf
from ZeroHedge News https://ift.tt/lxgNPaf
via IFTTT


0 comments
Post a Comment