
The Bear Case In 12 "Charts Of Darkness"
While most sellside analysts and strategists are throwing in the towel as the market continues its relentless meltup (one which according to Goldman is becoming increasingly "painful" for the bank's institutional clients most of whom have taken the other side of the trade), there are still a handful of hold outs who refuse to chase the price action and instead have made a stand of sorts, predicting that it's just a matter of time before stocks reverse much of their 2021 gains.

One such stubborn holdout is BofA whose Chief Investment Strategist, Michael Hartnett has for much of the past six months been warning that a stagflationary bust in the economy is coming, in keeping with BofA's year-end target of 3,800.
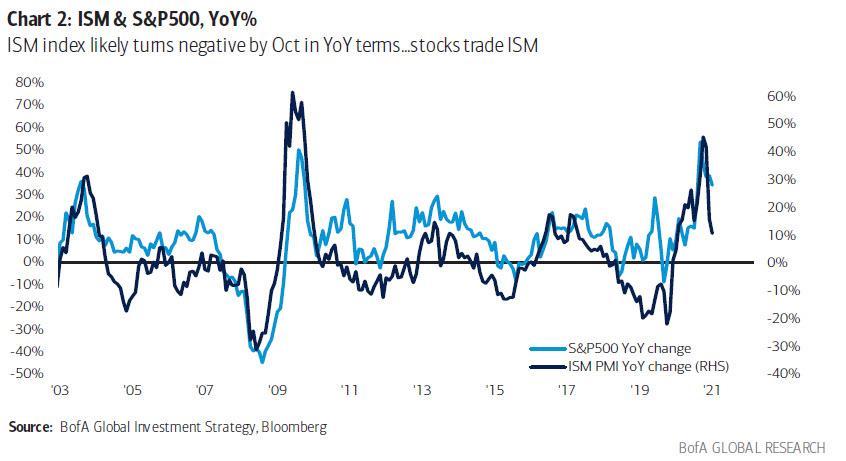
Last Friday, in his weekly Flow Show notes, Hartnett went so far as to put a tentative time for when he expects stocks to reverse. Pointing out that the annual change in stocks closely tracks that of the ISM/PMIs with a slight lag, Hartnett said that October is when the chickens will come home to roost as that's when the .average ISM PMI will turn negative, with stocks set to follow.
It's not just the correlation: in keeping with his favorite 3Ps - Policy, Prices and Profits - Hartnett lays out several other reasons why the 4th P, the party, can't keep going on forever. Here are some of his observations in the context of the 3Ps:
- On policy: investors have zero fear of central banks…NZRB baulked at raising rates this week despite NZ house prices up 30%; Fed has bought $4tn bonds past 18 months (2X amount US spent on War in Afghanistan past 20 years), global central banks have spent $834mn every hour buying bonds since COVID, US government spending $875mn every hour in ’21…little wonder everyone believes in TINA & BTD.
- On prices: stimulus has caused immense inflation of Wall St assets; more recently inflation on Main St…July 6-month annualized US CPI 7.8%, core US CPI 6.8%, US house prices (May) 19.7%; Canada CPI @ 20-year high; UK/Canada/NZ/Australia real estate surging; "pipeline inflation" PPI's popping in US/China/Japan; secular themes of geopolitical risk and nationalism crushing globalization remain inflationary.
- On profits: V-shape recovery was v strong but inflation now inducing stagflation; economic surprise indices -ve in US/China/Japan, auto production plummeting in US/Germany/Japan, US consumer confidence smacked to 10-year lows, US home sales - 13% from peak; China growth wobbling, US consumer has peaked, US fiscal optimism fading, Fed potential “policy mistake”…rising risk of autumn “flash recession” (likely revealed via sharp dip in global PMI’s).
Hartnett concluded by predicting "negative returns stocks & credit in H2", but one week later, both stocks and credit keep rising, with the S&P closing above 4,500 for the first time.
So fast forward one week when in his latest Friday Flow Show, Hartnett - getting more and more gloomy as a result of the meltup that just one stop - published a note titled Charts of Darkness, which recaps his pent-up disillusionment with the market in the form of a thematic “dirty dozen” charts on the pandemic, the macro dislocations, wealth inequality caused by the central bank liquidity supernova, coming stagflation & the H2 EPS risks from the US consumer, China & credit markets.
So without further ado, let's go down the list of charts starting with...
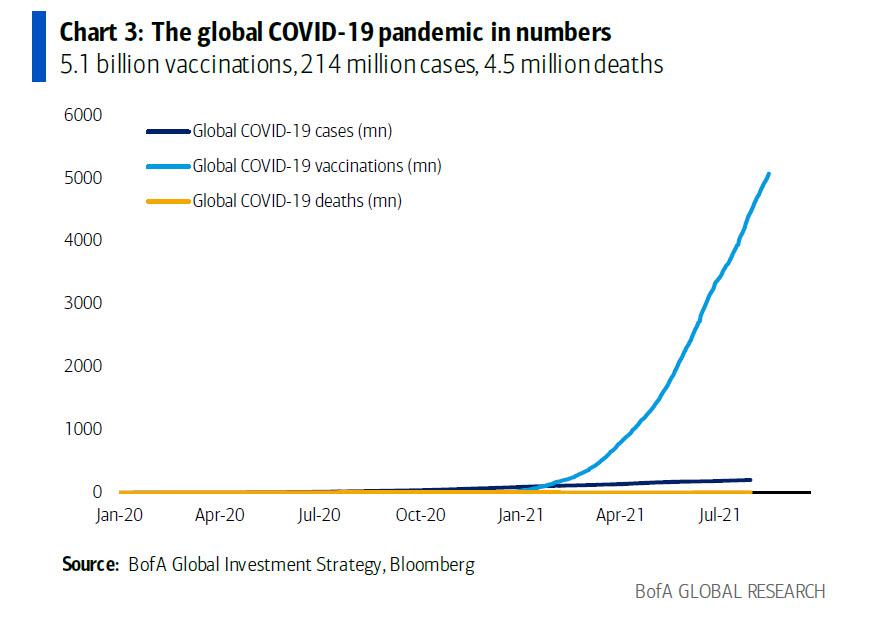
Pandemic: COVID-19 pandemic by the numbers…5.1 billion vaccinations, 214 million cases, 4.5 million deaths (Chart 3); the policy reaction…$32 trillion of monetary and fiscal stimulus; the Wall St reaction…global stock market capitalization up $57 trillion in 18 months; despite >5bn vaccines, societies & economies remain hostage to the pandemic, allowing Wall St to discount endless stimulus to the benefit of asset prices; the “end” of the pandemic will be very negative for Wall St, but few think it “ends” soon.
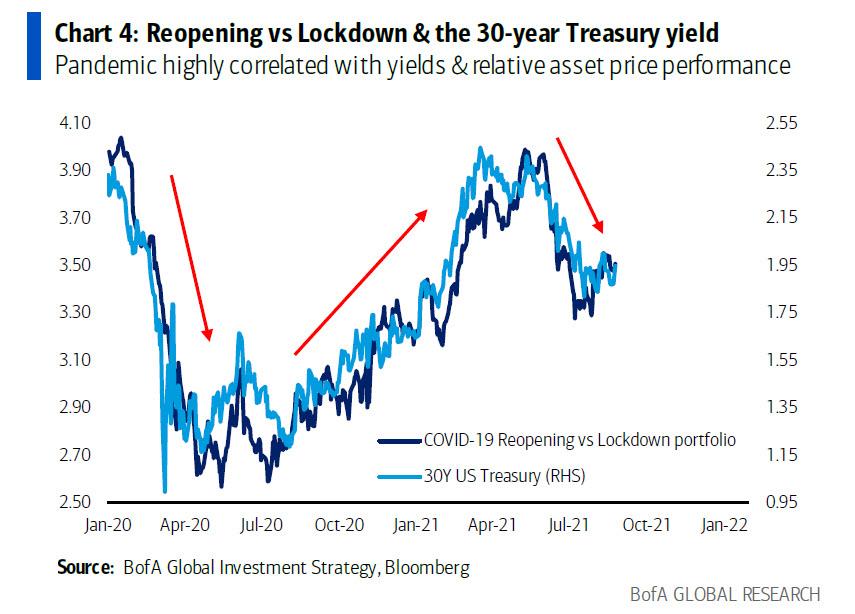
Pandemic & Wall St: the battle between lockdown & reopening battle has caused significant relative asset price movements; the performance of reopening vs lockdown baskets is highly correlated with bond yields (Chart 4) as well as the relative performance of HY bonds vs IG bonds, small cap stocks vs large cap, value vs growth and so on (see last week’s Flow Show); the Delta variant in the past two months has caused “lockdown” to outperform “reopening”.
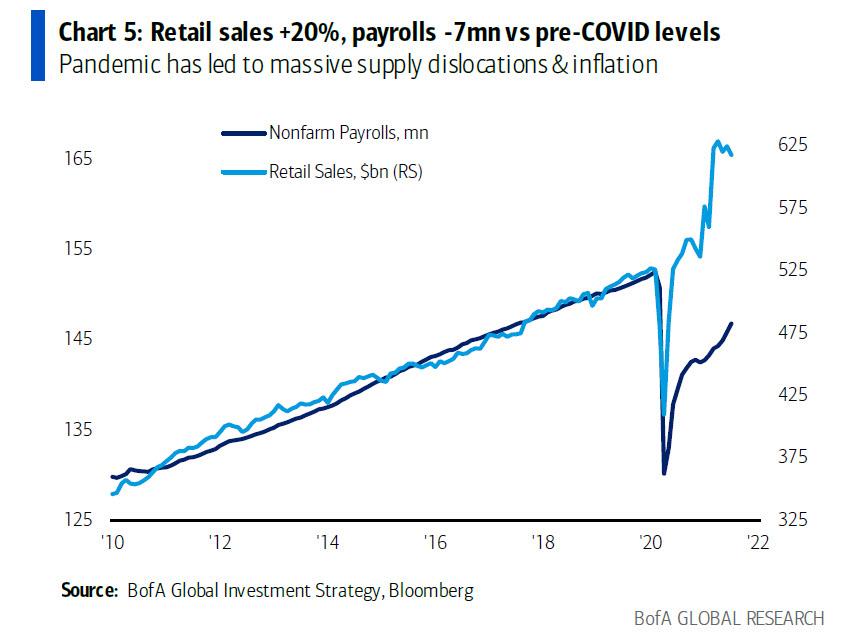
Pandemic & Main St: pandemic and emergency support for the economy has also led to massive dislocations in the economy, most evident in massive supply disruptions to goods, services & labor markets, which in combination with a “transitory” surge in consumer spending, has led to a significant inflation of goods, services & wages; note US retail sales (which have peaked) are roughly 20% above pre-COVID levels, while US payrolls are 7 million below their pre-COVID levels, despite record levels of job offers (see Chart 5); the pandemic has not only dislocated local labor markets, it is also accelerating the trend away from globalization toward isolationism; local and global supply chains are unlikely to mend anytime soon…stagflation the new investment backdrop to markets.
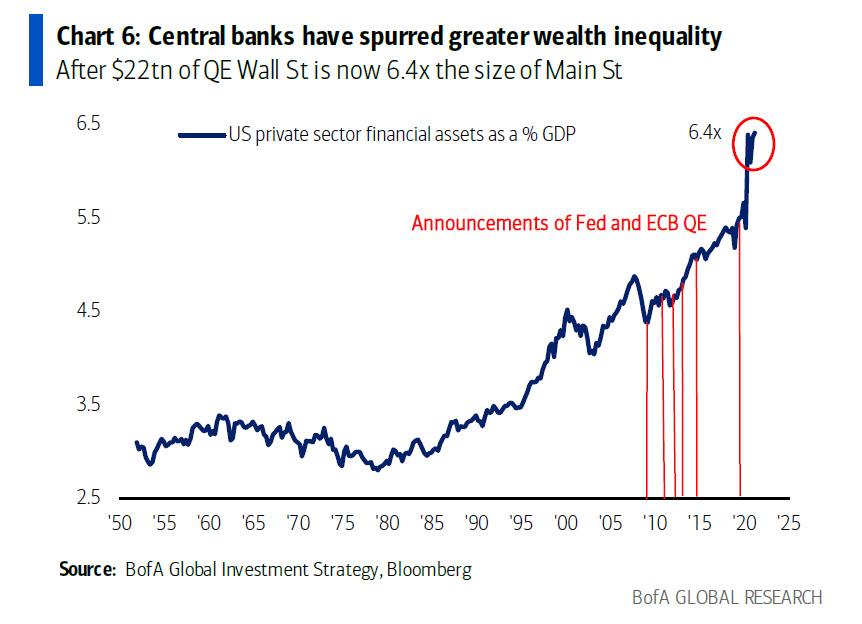
The Fed & Inequality: the central bank response to COVID-19 has “accelerated” inequality; between 1950 and the late-90s tech bubble, the ratio of US private sector financials assets (Wall Street proxy) vs the GDP of the US (Main Street proxy) oscillated between 2.5x and 3.5x; the radical interventionist policy of Quantitative Easing since the GFC has seen global central banks buy $22.4tn of financial assets (Fed & ECB have launched 7 QE programs – Chart 6), boosting the valuation of financial assets in the US to 6.4x the size of GDP.
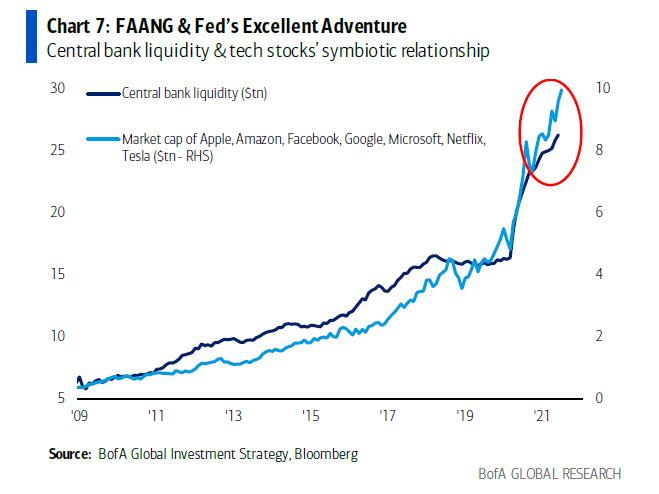
The Fed & Tech: Fed’s determination to stoke Wall St exuberance & Main St inequality has been particularly positive to the US tech sector; the market cap of FAAMG + Netflix & Tesla equates to the 3rd largest country in the world in GDP terms; the Fed has been tech’s best friend for the past 10 years (Chart 7)…it’s no coincidence that since the outbreak of COVID-19 global central banks have bought $834mn of financial assets every 60 minutes…and every 60 minutes the market cap of global tech stocks has risen $780mn.
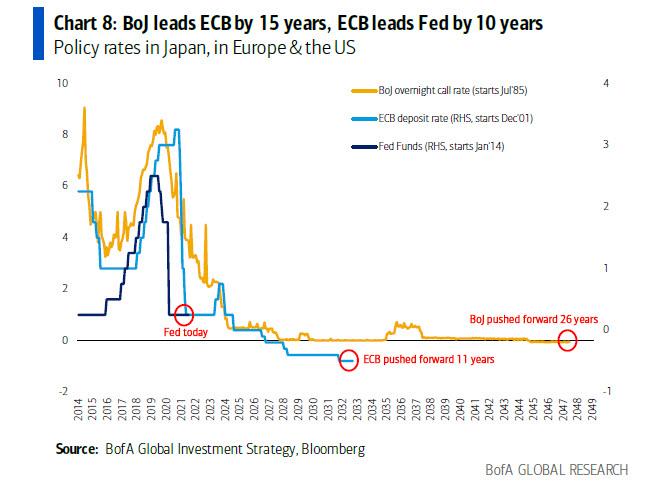
The Fed & the BoJ & the ECB: BoJ has operated a zero interest rate policy for over 20 years, the ECB for almost 10 years, neither have been able normalize monetary policy, and both remain the “cement in the Fed’s shoes” (Chart 8); note zero rates in Europe & Japan in recent decades have not been asset positive; the US is different with a housing market that still is rate-sensitive, and a behemoth tech sector within the domestic equity market.
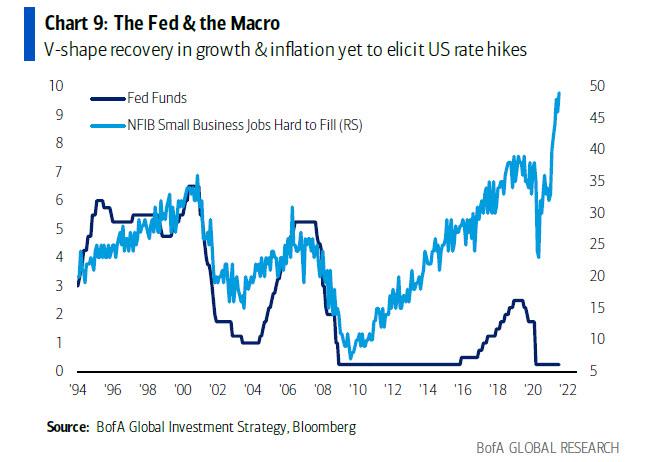
Monetary tightening: the V-shape economy recovery since Q1’20 (Chart 9) & the inflation of asset prices, housing prices, commodity prices, consumer prices, is causing a very slow & protracted turn in monetary policy; for example, in 2021 there have been 41 rate hikes and 11 cuts (c/o 5 rate hikes & 95 cuts in 2020); the most important central bank in the world, the Fed, has thus far remained steadfastly against a tightening of monetary policy; but the inflation of asset prices, housing prices, commodity prices, consumer prices means the Fed’s liquidity tailwind is likely to weaken dramatically in coming quarters.
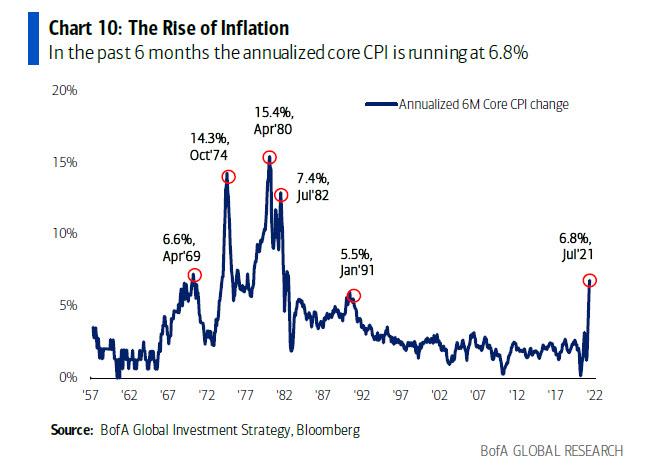
Inflation: inflation has soared in 2021 and it is highly unlikely to vanish as quickly as it appeared given the structural changes (War against Inequality) and pandemic unintended consequences (supply chain dislocation); in the past 6 months the annualized rate of CPI inflation was 7.8%, of core inflation was 6.8% (Chart 10), US house prices was 19.7% (May) and "pipeline inflation" PPI's are popping higher in US/China/Japan.
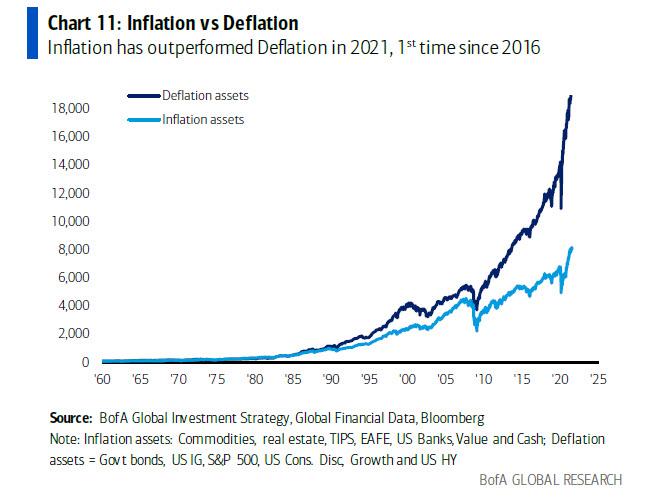
Inflation vs deflation: investors are structurally positioned for deflation; as cyclical bears we think H2’21 will see outperformance of high quality defensives; but we continue to argue that longer-term the inflation theme will win and the US dollar will lose; note YTD in 2021 inflation assets are outperforming deflation assets (see Chart 11 for definitions) for the 1st time since 2016.
Peak profits: the BofA Global EPS model says global EPS peak was ≈ 40% in April (model driven by China FCI, Asia exports, global PMI, US yield curve); global EPS is projected to decelerate very sharply to 9% by November (Chart 12); this will be driven by inflation, supply bottlenecks, unwillingness of companies to increase inventories given Delta, peak US consumption, China economic weakness, fiscal cliffs and geopolitical risks; decelerating profit growth means quality>junk, defensives>cyclicals tactically.

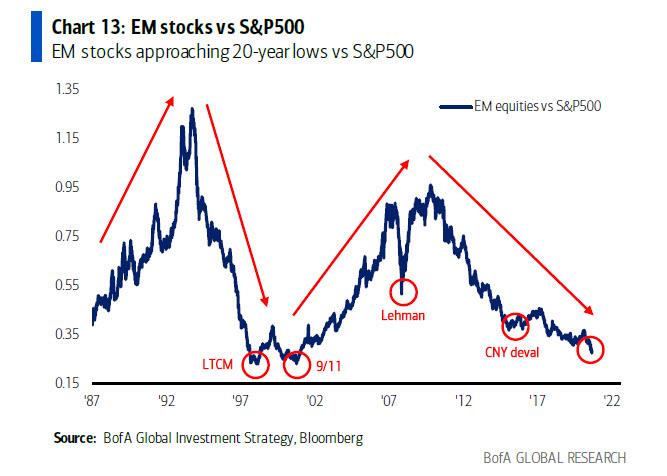
China: EM stocks are approaching 20-year low versus S&P500 (Chart 13); big lows in EM are normally triggered by cathartic events (LTCM, 9/11, Lehman) but EM unambiguously where the secular value is, e.g. EM bonds cheapest relative to US high yield in 20 years; China has been the lead indicator for the virus, the lockdown, the reopening, the tech boom, the tapering, the tightening; China HY spreads have risen sharply to 1277bps, as investors fret about a “credit event” in China.
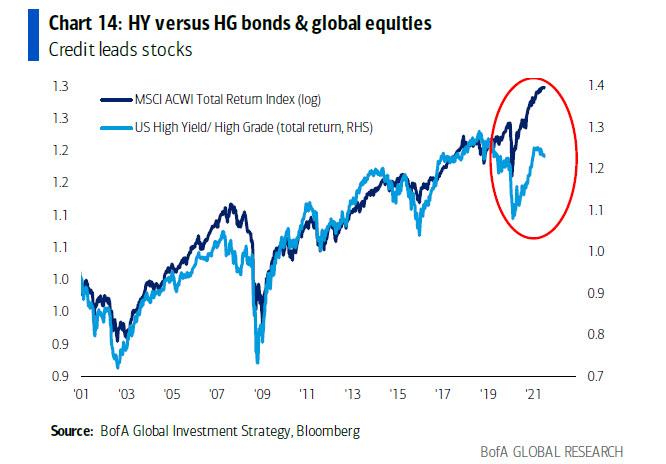
Credit: credit leads stocks and financial repression continues to keep spreads low (excluding China); but note the relative underperformance of HY bonds vs IG bonds, not a good leading indicator for stocks (Chart 14).
https://ift.tt/2Y5E3r8
from ZeroHedge News https://ift.tt/2Y5E3r8
via IFTTT


0 comments
Post a Comment