
Are Market Bulls Too Optimistic? Tyler Durden Sun, 05/31/2020 - 11:01
Authored by Lance Roberts via RealInvestmentAdvice.com,
Market Breaks Above The 200-DMA
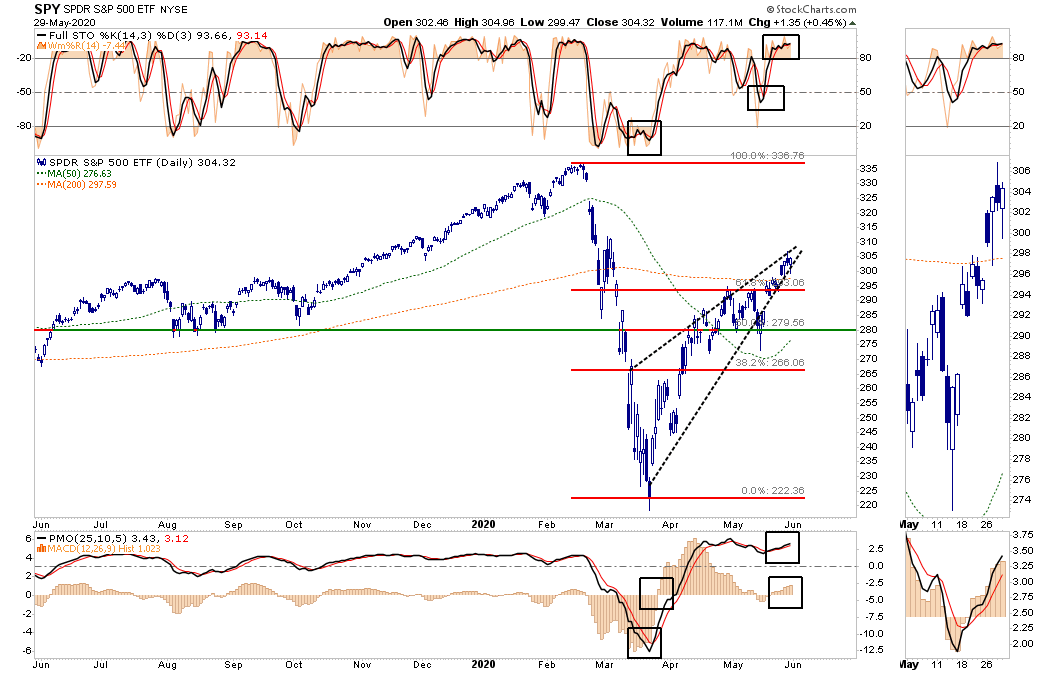
In last week’s missive, we discussed how the market remained stuck between the 50- and 200-dma. At that time, we noted the risk/reward ranges, which encompassed a breakout or retracement within that range. (The chart is updated through Friday’s close.)
The shaded blue area shows the containment of the market between the two moving averages. With the market very overbought short-term (orange indicator in the background), there is downside pressure on prices short-term.
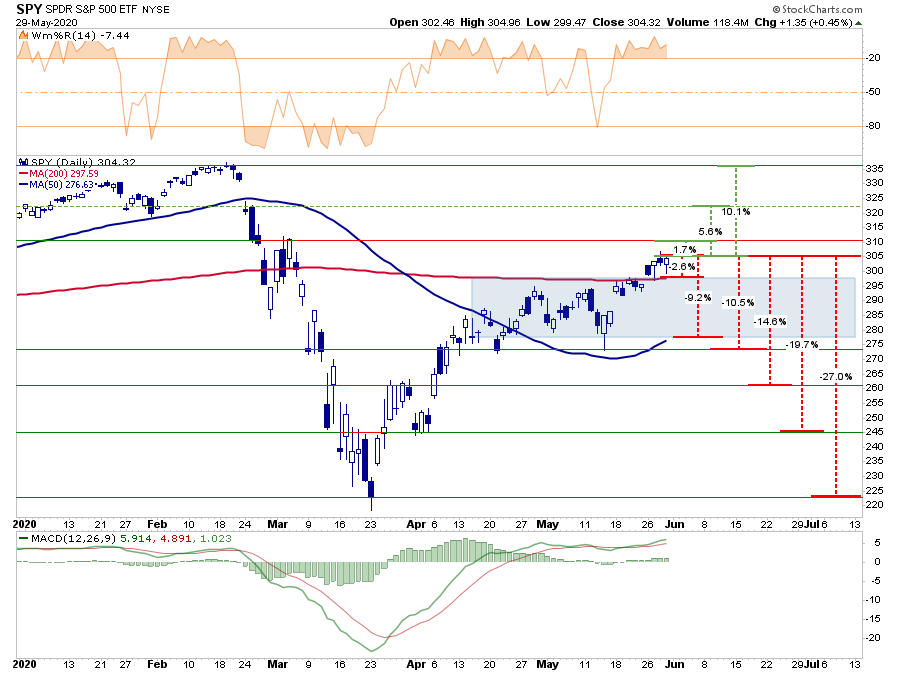
While the market did break above the 200-dma, such does not change the negative risk/reward characteristics of the market.
-
-2.8% to the 200-dma vs. +1.7% to the March peak. Negative
-
-9.2% to the 50-dma vs. 5.6% to February gap down. Negative
-
-10.5% to the consolidation support vs. +10.1% to all-time highs. Neutral
-
-19.7% to April 1st lows vs. +10.1% to all-time highs. Negative
-
-27% to March 23rd lows vs. +10.1% to all-time highs. Negative
However, as stated last week, the break above the 200-dma is currently changing the complexion of the market.
“If the markets can break above the 200-dma, and maintain that level, it would suggest the bull market is back in play. Such would change the focus from a retest of previous support to a push back to all-time highs.
While such would be hard to believe, given the economic devastation currently at hand, technically, it would suggest the decline in March was only a ‘correction’ and not the beginning of a ‘bear market.'”
While the negative risk/reward dynamics are evident, the more negative outcomes are becoming less probabilistic. However, on a longer-term basis, a deeper correction becomes more possible, given the deviation in prices from the underlying fundamentals.
Are Market Bulls Too Optimistic
Currently, the markets are rallying in hopes of a “V-Shaped” economic recovery, which will be supported by a COVID-19 vaccine and no second wave of the virus. If such is the case, then it is expected the depression level readings of unemployment and GDP will quickly reverse, supporting the stock market’s current valuations.
There are several underlying problems with this narrative:
-
There is a very high probability that as states reopen their economies, there will be a “second-wave” of COVID-19.
-
Out of the dozens of companies that are in the process of developing both therapeutics and a potential vaccine, the odds are incredibly high the vast majority, if not all, will fail.
-
Corporate profits and earnings were already struggling, heading into the recession. While they will rebound as the recession passes, they are unlikely to return to levels to support current valuations.
-
Unemployment will likely remain higher for longer than expected. Up to 50% of small businesses, which account for about 25% of all employment, are expected to shutdown. Consumption, which is where earnings and profits come from, will be cut accordingly.
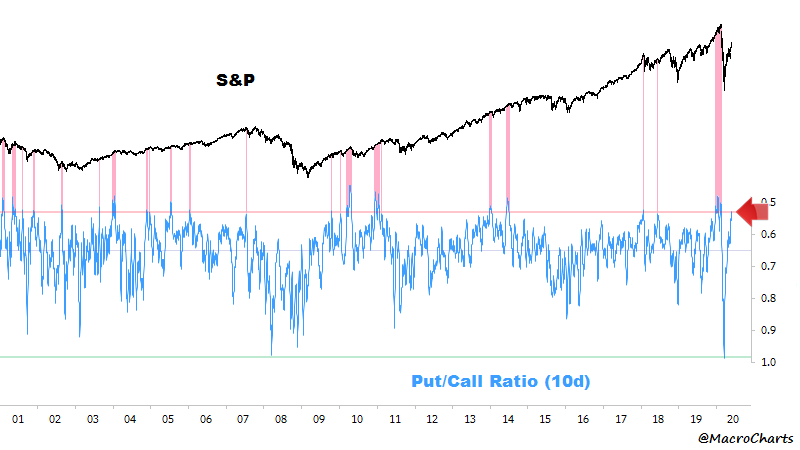
Currently, investors have gotten back to more extreme stages of bullishness as the market has relentlessly rallied from the lows.
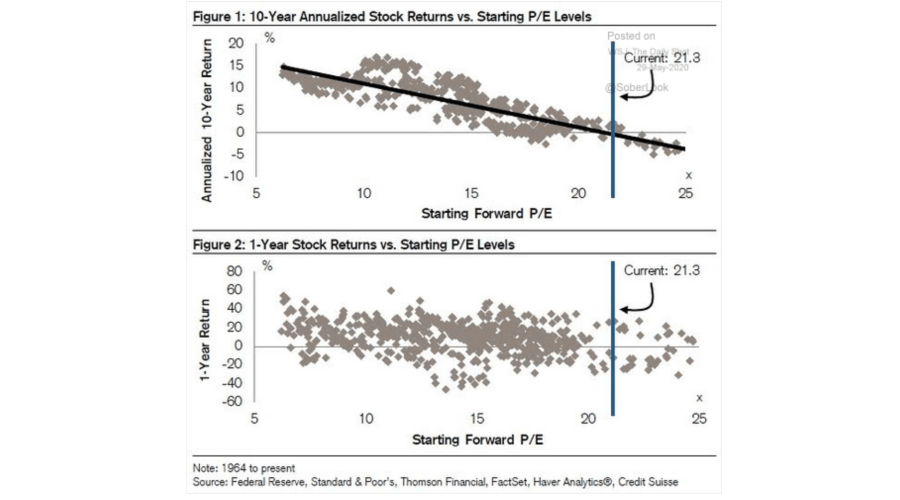
Valuations Matter Long-Term
However, the complete detachment from the underlying fundamentals is likely to weigh on the markets soon than later. Irrespective of Fed stimulus, valuations do matter over the longer-term time and will drive forward returns.
The problem is the valuation levels are worse than shown as earnings are still being revised lower, and will get worse. We know this because corporate profits were released this past week for Q1 and showed a record drop. That drop was for a quarter where the shutdown accounted for only 2-weeks of the reporting period. The decline in the second quarter will be materially worse as the entire month was lost to the pandemic.
Castle Of Sand
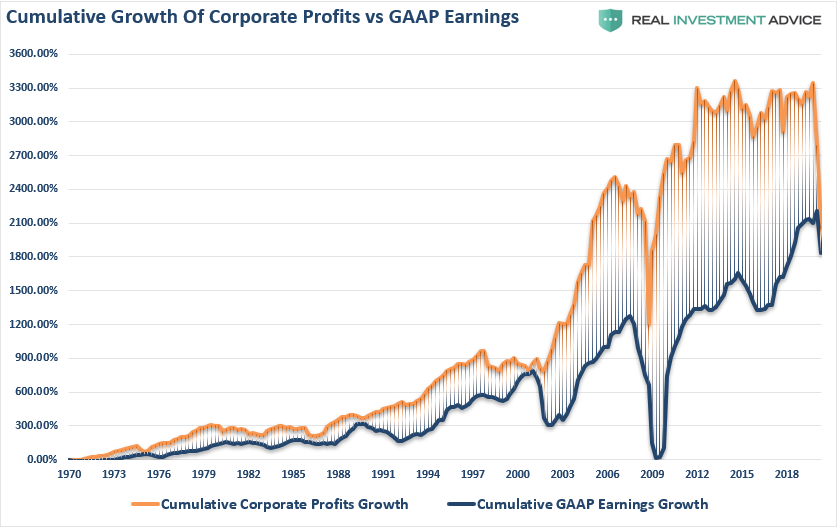
We can see the deviation between GAAP earnings and corporate profits if we use the data for first-quarter.
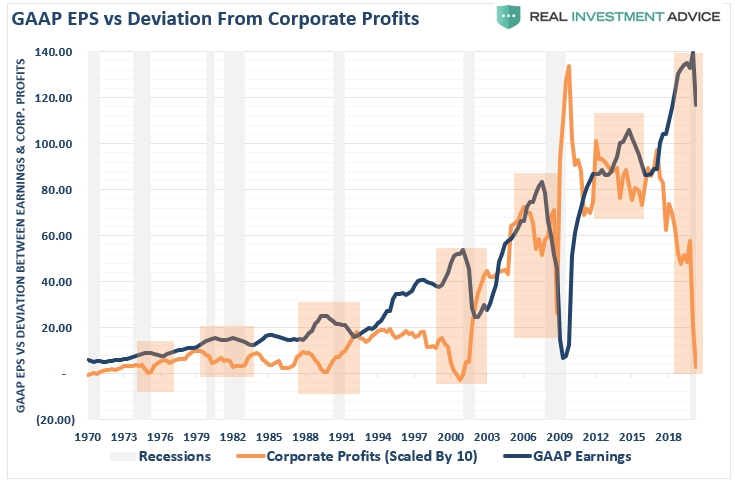
The shaded areas show the lag between the decline in profits and the decline in GAAP earnings. Over the next couple of quarters, profits are forecasting a much deeper decline for S&P 500 earnings. With estimates still in the $95/share range, we could see a rather substantial decline.
As stated, investors have priced in a “perfect” economic recovery story. Such leaves much room for disappointment as the deviation between what investors “expect,” and “reality” is at the highest level on record.
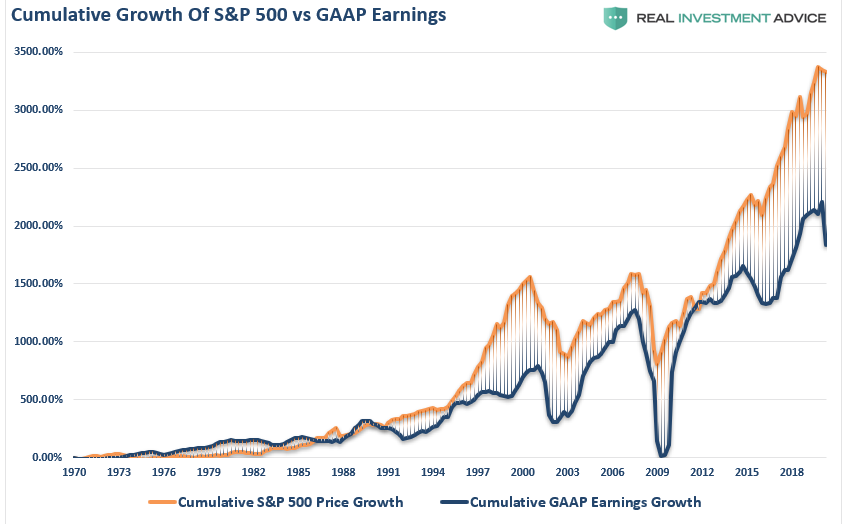
Historically, sharp declines in corporate profits are met by equally sharp declines in GAAP earnings.
While investors are “hopeful” this time will be different, the reality of 40-million unemployed, mass failures of small businesses, and a contraction in consumption, argues differently.
“It’s too ‘happy days are here again. It’s just not going to work like that. Not with 38 million unemployed. You can’t keep building on a castle of sand. I see a lot of quicksand underneath some moves. I wish we would just calm down and digest some of these things.” – Jim Cramer, Mad Money
Technical Review Of The Market
No matter how you want to slice the data, the markets are back to more egregious overbought conditions on a short-term basis. With the markets very overbought, and in a very tight ascending wedge, watch for a break to the downside to signal the start of a correction.
Also, with roughly 95% of stocks now trading above the 50-dma, such has historically signaled short-term corrections to resolve the overbought condition.
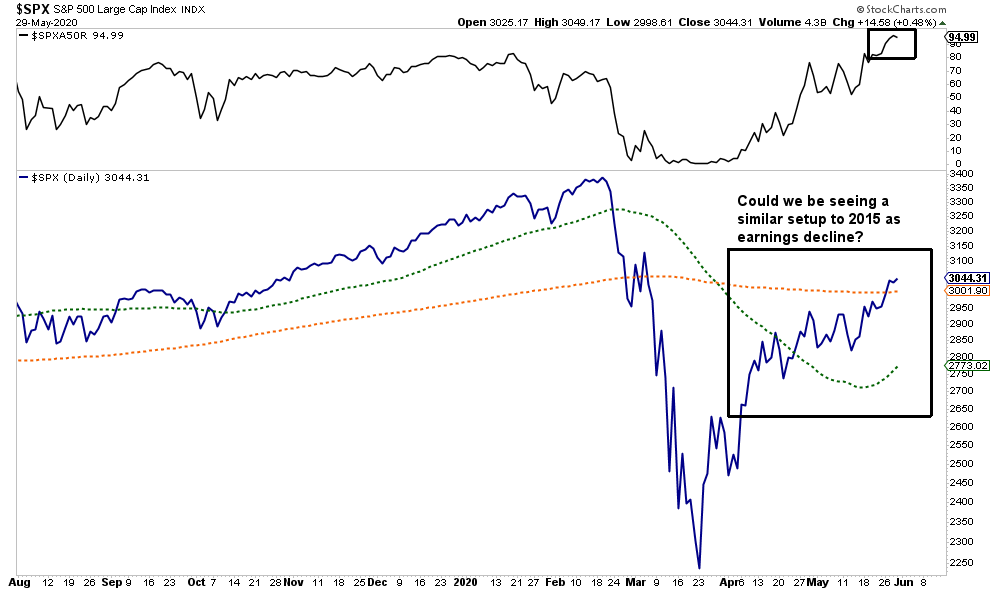
While much of the media has been talking about positive returns from stocks over the next 12-24 months, we could also have a 2015-2016 type scenario.
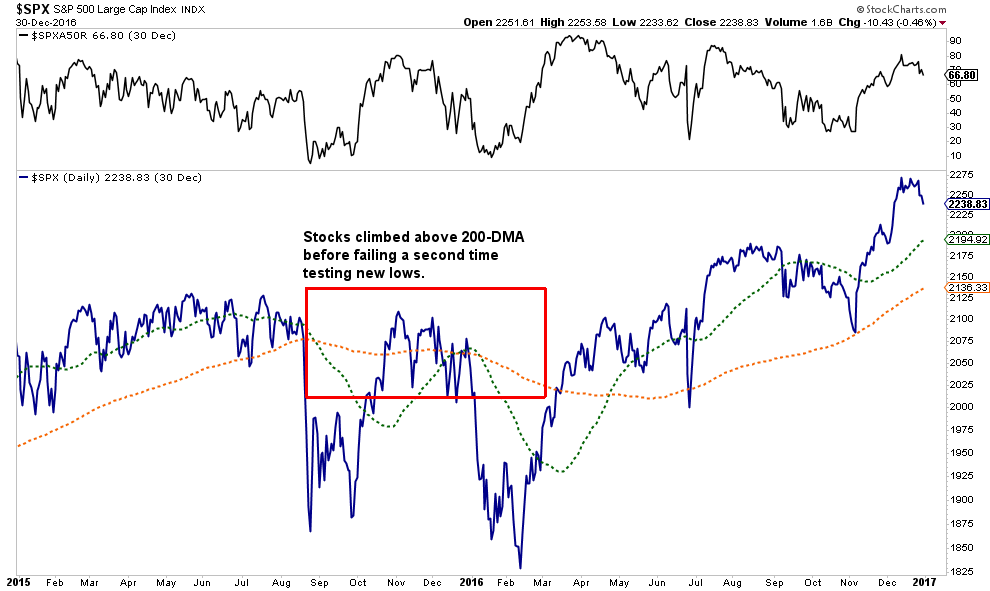
At that time, the markets climbed above the 200-dma, combined with a “Golden Cross” as the 50-dma also “crossed the Rubicon.” While the media bristled with bullish excitement, it was quickly extinguished as the markets set new lows as “Brexit” engulfed the headlines.
Importantly, while concerns about a “Brexit” on the global economy were valid, “Brexit” never materialized. Conversely, the economic devastation in the U.S., and globally, is occurring in real-time. The risk of a market failure as “reality” collides with “fantasy” should not be dismissed. It CAN happen.
Lastly, speaking of the number of stocks above the 50-dma, that indicator is laid behind the S&P 500 in the chart below. Historically, whenever all of the overbought/sold indicators have aligned, along with the vast majority of stocks being above the 50-dma, corrections were close.
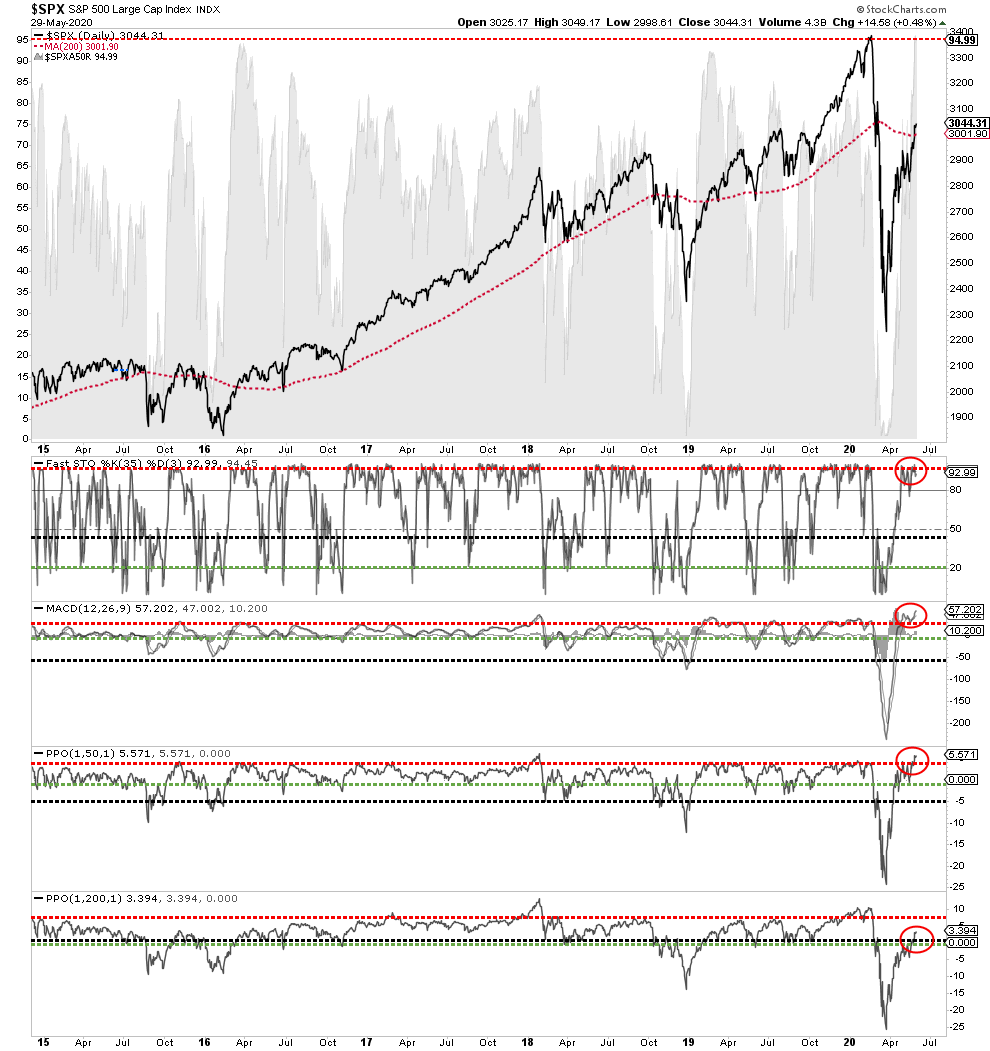
Such doesn’t mean the next great “bear market” is about to start. It does mean that a correction back to support that reverts those overbought conditions is likely. Therefore, some prudent risk management may be in order.
https://ift.tt/3gOBSx4
from ZeroHedge News https://ift.tt/3gOBSx4
via IFTTT


0 comments
Post a Comment