One Bank's "Persistent Inflation" Meter Just Hit A Record 96 Out Of 100
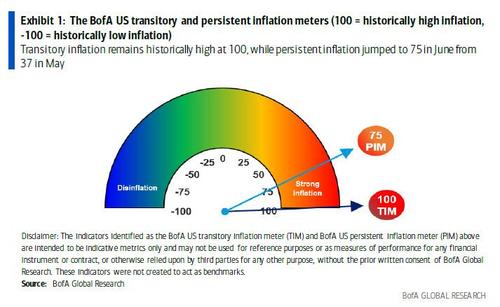
Earlier this year, as Wall Street first became obsessed with distinguishing transitory vs non-transitory (i.e., permanent) inflation, Bank of America launched two trackers - a transitory and a non-transitory inflation meter. Initially, it was mostly good news: while the bank's transitory inflation meter was at 100, or the highest reading possible, non-transitory inflation was subdued, at just 37 back in May.
However one month later, an ominous trend emerged: while "transitory" inflation was stuck at the highest reading possible, "non-transitory" inflation doubled to 75 in June.
Needless to say, this was the time when the so-called "transitory inflation bros" starting to lose the argument that soaring inflation would fade away in just a few months, with sticky inflation such as rent and housing pushing sharply higher even as some transitory components such as used car prices and airfares eased off somewhat.
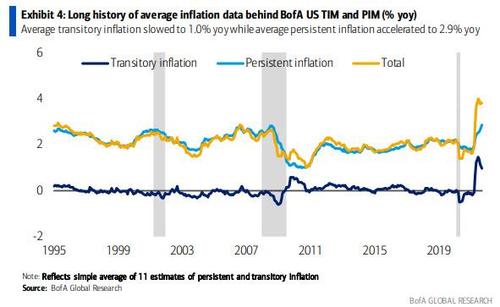
Alas, since then prices have only continued to rise, and in September core CPI rose 0.24% in September, just barely rounding down to a 0.2%; here one of the biggest stories was the surge in owners’ equivalent rent (OER) and rent of primary residence to a 0.43% and 0.45% mom clip, far above the prior 0.2-0.3% mom trend. This pointed to much stronger persistent price pressures.
Meanwhile, transitory drivers of inflation were more muted. On one hand, reopening-related components were a drag, as were some commodities such as apparel and used cars. On the other hand, new car prices and household furnishings & supplies gained. However, as we noted recently, used car prices tracked by the Manheim Used Car Index just soared to a new all time high, suggesting that upcoming CPI prints will see both transitory and persistent inflation components rising sharply.
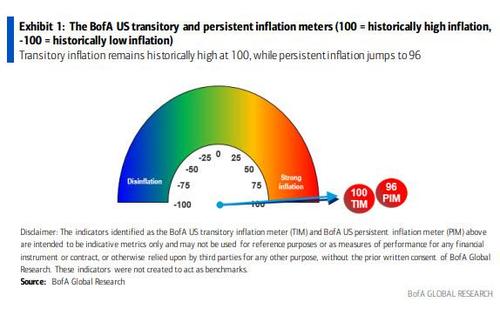
So consistent with the move in rents, the BofA US persistent inflation meter finally gave up all hope that inflation is coming down any time soon, and surged to 96 in September from 80 previously "suggesting historically elevated cyclical price pressures." Meanwhile, even though transitory inflation cooled somewhat on a % yoy basis in September, it remained historically elevated. As such, the BofA US transitory inflation meter printed 100 for the sixth straight month.
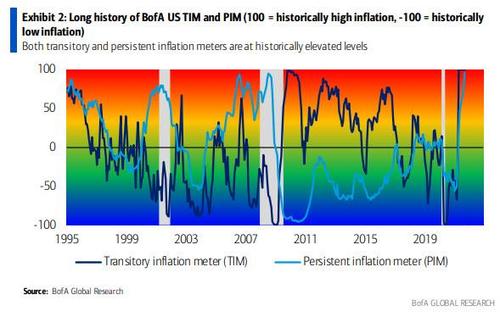
And as the next chart shows, never in the history of the data (which sadly goes back only to 1995) have both transitory and persistent inflation readings been at an all time high at the same time.
And while this should put to rest the debate about whether the current episode of runaway inflation will fade away any times soon (it won't), the bad news is that should economic growth continue to shrink at the current ominous pace - as a reminder the Atlanta Fed sees Q3 GDP growing just 0.5% - America is about to be reminded just how miserable life is under stagflation (for a quick preview of what is coming, please read "Is Stagflation Here: Comparing The 2020s With The 1970s...").
https://ift.tt/2XIKSyU
from ZeroHedge News https://ift.tt/2XIKSyU
via IFTTT


0 comments
Post a Comment