
A Historical Guide To How Stocks Perform During Tightening Cycles
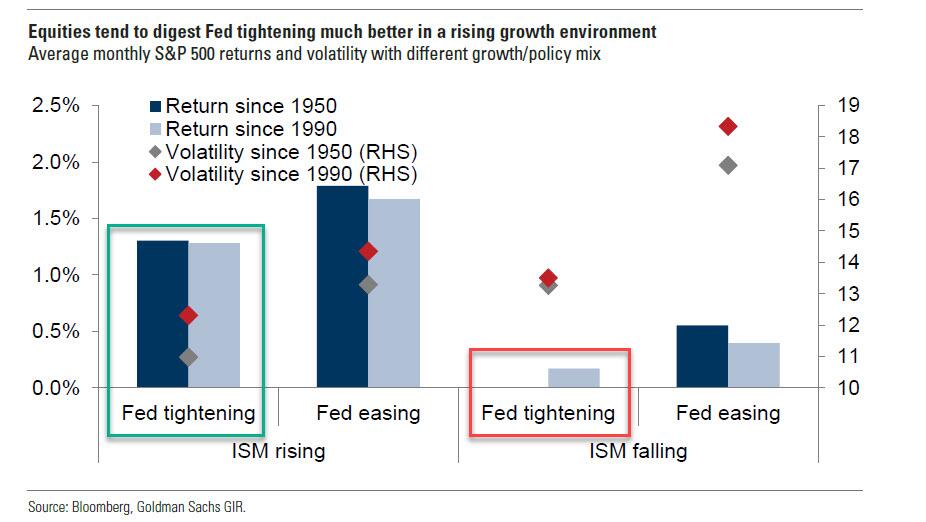
When Wall Street strategists - a vast majority of whom are bullish - address the touchy topic of how stocks react during a tightening cycle, the first thing they will point to is that the S&P 500 has traditionally seen positive returns during tightening cycles (in two of the last seven cycles, the S&P 500 peak occurred within the range of 6 months prior to the initial hike to 12 months after the initial hike), however this is almost always the case only when growth is rising, for example as indicated for example by a rising ISM. When the Fed is tightening into a slowing economy - i.e., when the ISM is falling like now- returns since 1950 are the flat and the worst of all possible permutations.
But an even bigger risk to the upcoming tightening cycle, where banks are now rushing to outbid each other on how many rate hikes they think the Fed will let loose before sending the economy into a recession, is that as Bank of America's Savita Subramanian writes, the "key risk today is that the Fed is tightening into an overvalued market."
Indeed, the S&P 500 today is more expensive ahead of the first rate hike than any other cycle besides 1999-00 (23x P/E vs. 30 P/E) and everyone remember what happened to the Nasdaq then. Making matters worse, this time the real cost of debt is negative, where in ‘99, the cost of equity was negative. The Fed Funds rate increased by 150bp during that cycle, and the market was up during the hiking, but the S&P peaked in March of 2000, and subsequently declined by 49% over the next 2.5 years

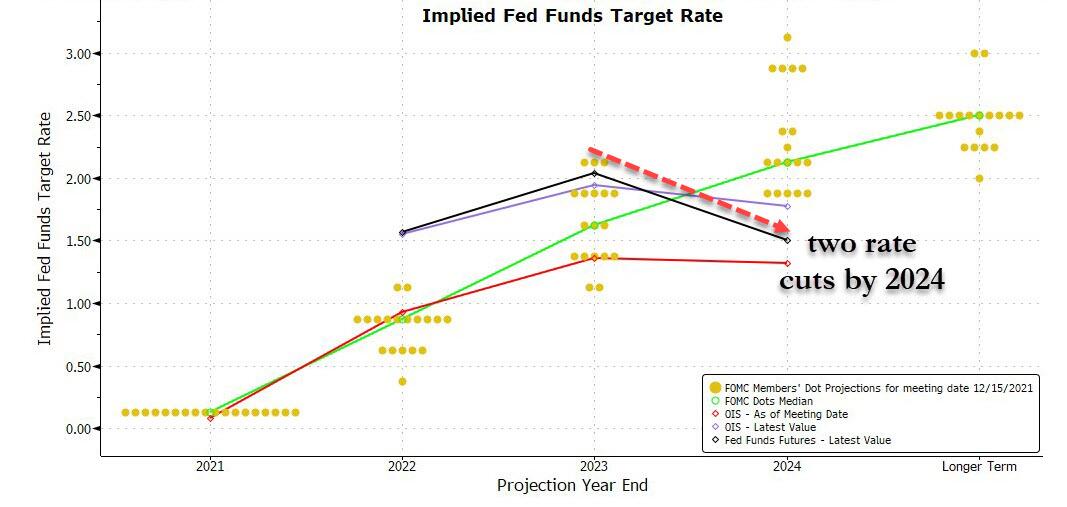
With those two major risk factors in mind, here is what to expect during the upcoming tightening cycle, however brief it may be (and it will be brief, since the Fed Funds futures are already pricing in at least 2 rate cuts before 2024):
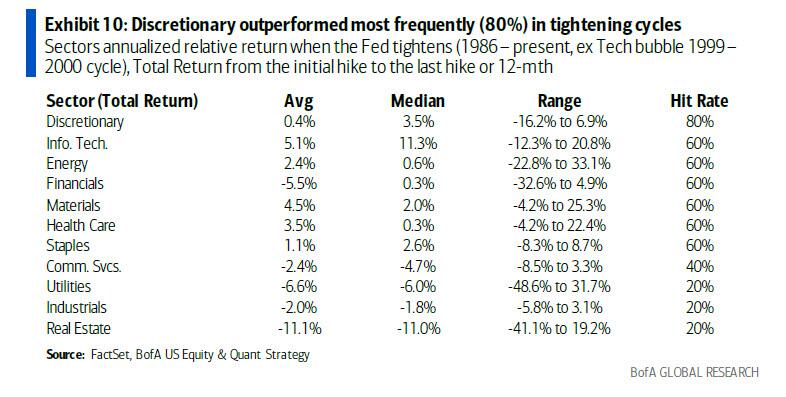
... according to Bank of America, bond proxies fare worst, cyclical sectors fare best.
The sectors which underperformed the index most consistently during historical tightening cycles were bond proxies (Utilities and Real Estate) along with Industrials (all with a 20% hit rate).Consumer Discretionary outperformed the S&P 500 in more cycles than any other sector but we see risks today on its high labor intensity amid wage pressures. Other sectors which have historically fared well are Tech, Energy, Materials, and Staples. But dispersion of sector alpha during hiking cycles was wide, indicating that factors rather than sectors may be a stronger explanatory variable.
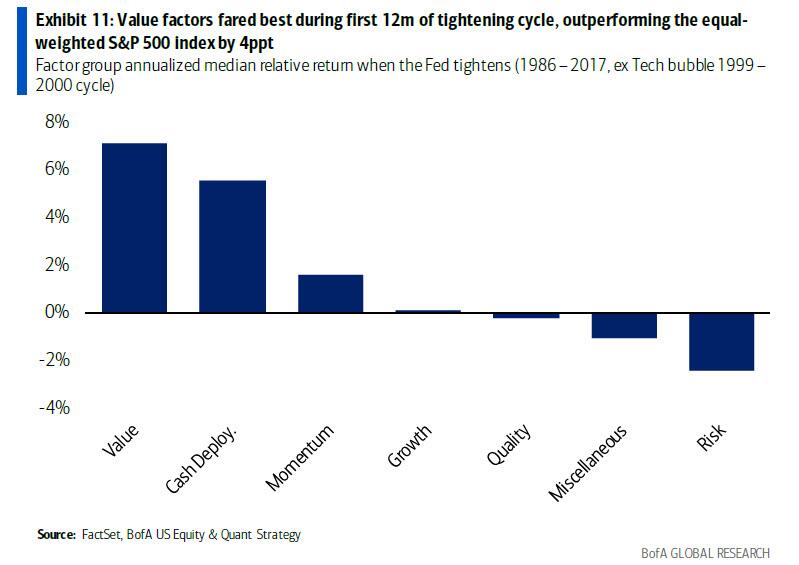
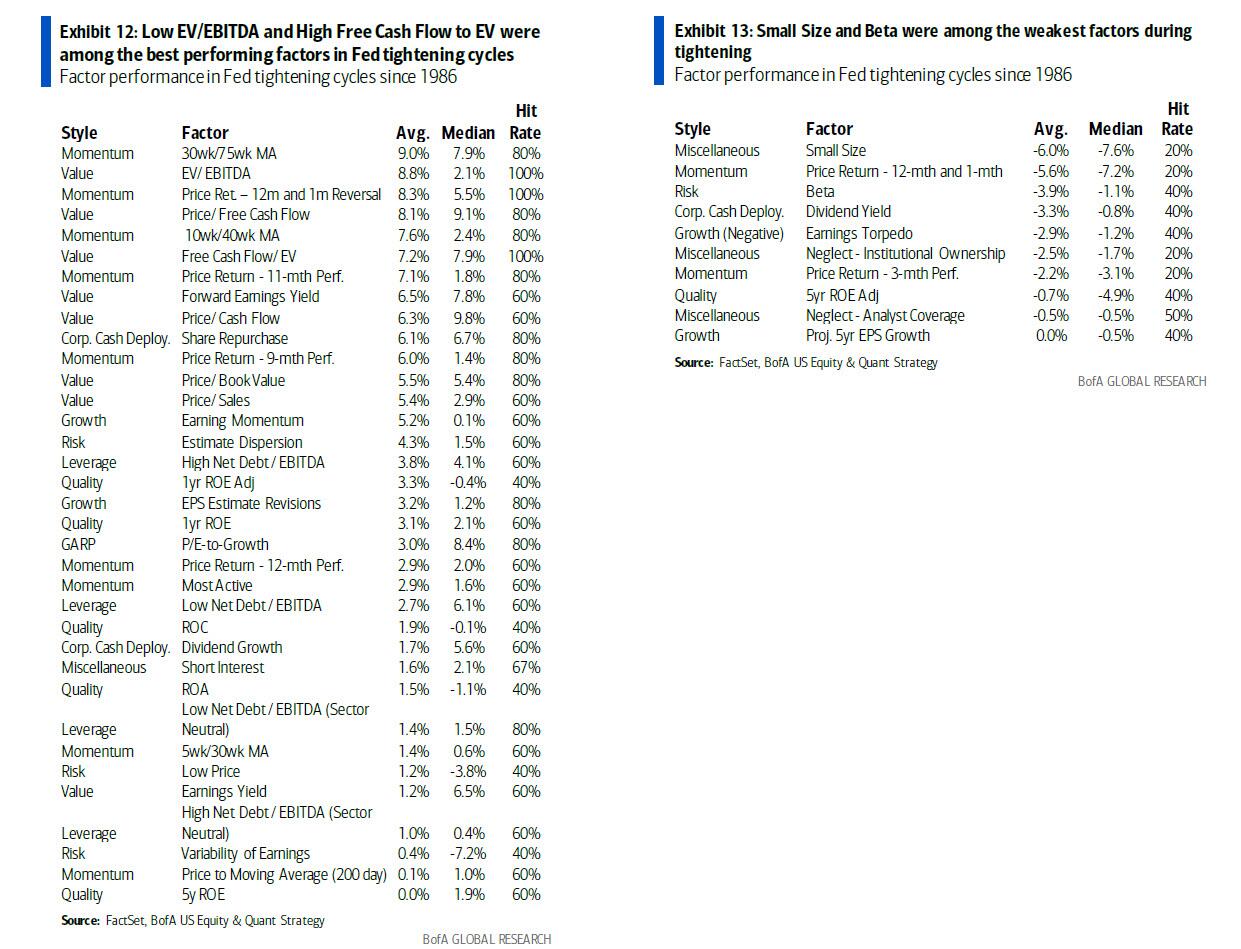
Value and Cash Return for tightening cycles: Factor performance in the initial 12 months of the Fed’s hiking cycles (or the entire length of the cycle if it was shorter than 12 months) indicate that Value (+7.1ppt vs. the equal-weighted S&P 500 index), followed by Cash Deployment (+5.6ppt) and Momentum (+1.6ppt) are superior factors. Risk factors lagged (-2.4ppt relative return). Returns-based Quality and Growth performed in line with the benchmark
Low EV/EBITDA, High Free Cash Flow /EV and Low Price / Book fared well, with Low EV/EBITDA and High FCF/EV leading the index in every cycle, and Low Price / Book outperforming in 80% of the cases. Sectors which are currently inexpensive on these metrics are Energy Materials on EV/EBITDA; Energy and Health Care and Materials on free cash flow to EV and Financials and Energy on Price to Book. Technical/Momentum factors like 12-m and 1-m Reversal Price Return and 30wk / 75wk MA were also strong. See tables below.
Energy consistently screens well on Value factors that outperform during hiking

Performance when tiered by size:
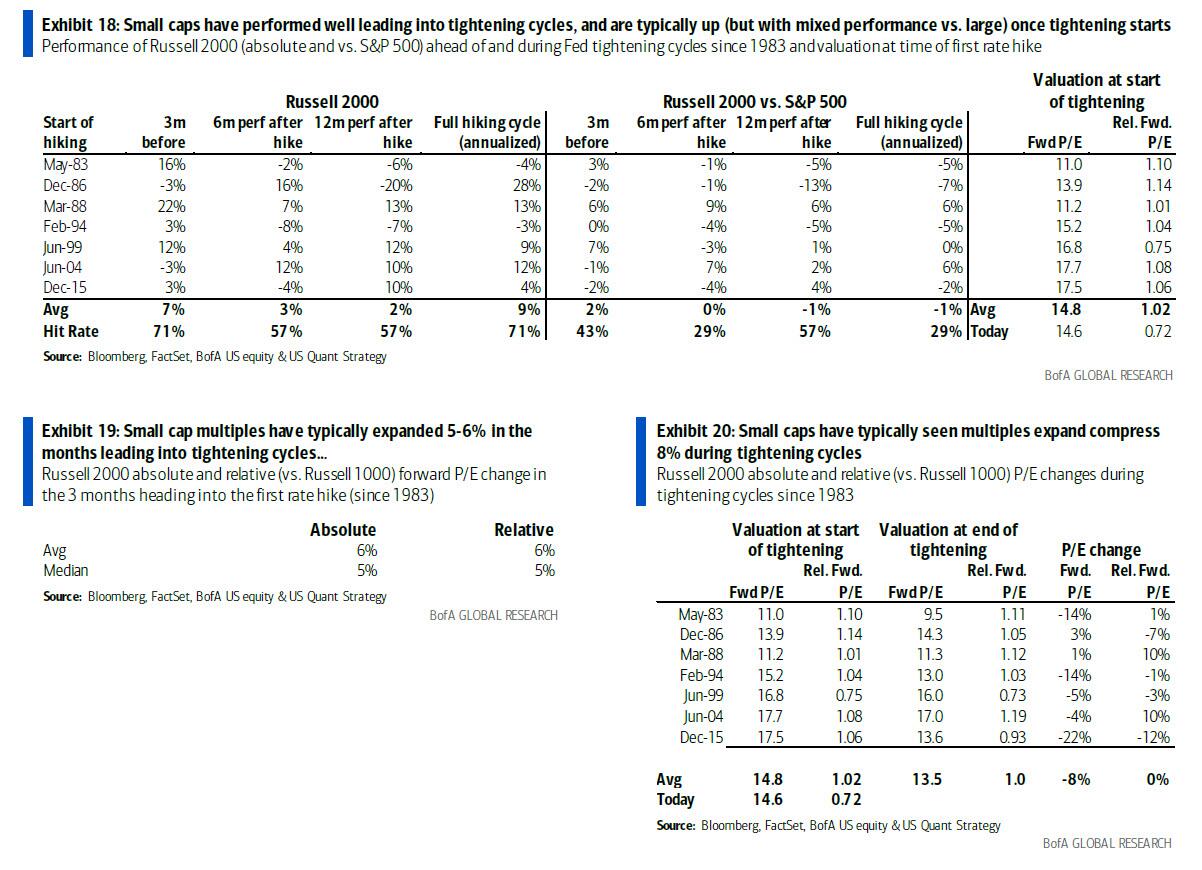
- Performance when the Fed hikes: Small caps have typically outperformed in the months leading into tightening and slightly underperformed over the course of hiking (by 1ppt – with both size segments seeing positive returns) – but unlike the majority of other hiking cycles, small caps are historically cheap vs. large caps today.
- Multiples reflecting the risks: Small caps’ P/E has typically risen 5-6% in the three months ahead hiking and compressed 8% during hiking. But the Russell 2000 P/E is already -12% since Nov., and the relative P/E is its lowest since 2000.
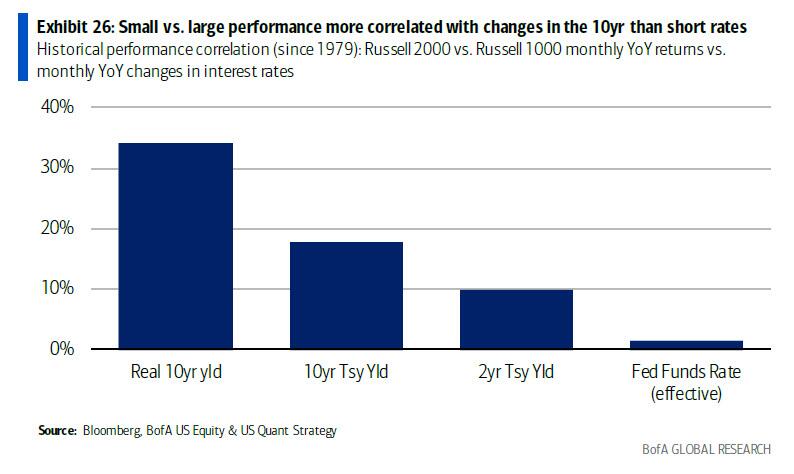
- 10yr more important than Fed Funds rate: Small vs. large performance is much more highlight correlated with changes in the 10-year (positive relationship) than changes in the Fed Funds rate (virtually no correlation).
- Faster tightening not more detrimental to small: BofA finds no consistent relationship between the pace of hikes and relative size performance (above).
Asset classes and Fed balance sheet shrinkage
According to BofA, during times of QT, history suggests that stocks>bonds, Value>Growth, large = small.

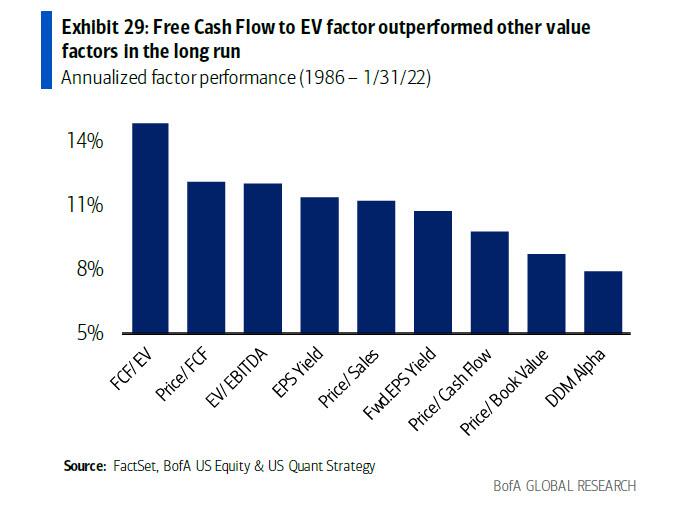
Factor Performance: Free Cash Flow is King
Stocks with attractive free cash flow (based on FCF/EV and FCF yield) have been among the best performers during historical Fed hiking cycles. FCF/EV ailed during the zero interest rate policy (ZIRP) period but has also been the best long-term stock selection factor out of all the Value factors we track.
Free Cash Flow to EV factor suffered during the Zero Interest Rate Policy (ZIRP) period…..but could begin to outperform again

Value factors have historically performed best during Fed hiking cycles (shown earlier). And work on Late Cycle regimes suggests that Free Cash Flow to EV was the most alpha-generative factor in Late Cycle periods historically.
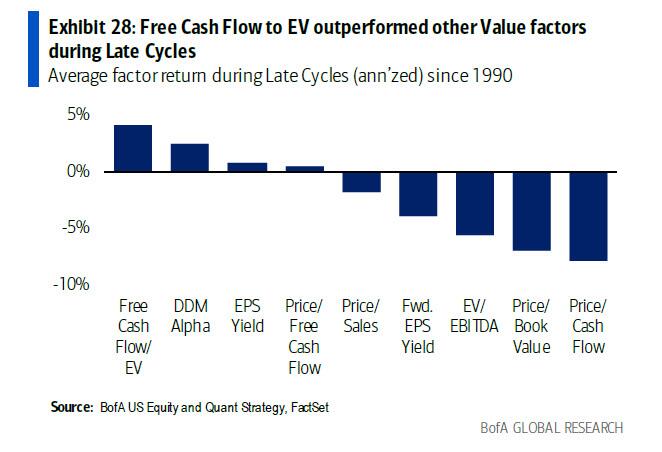
FCF/EV for the long-run: Free Cash Flow to EV factor outperformed other Value factors since 1986.
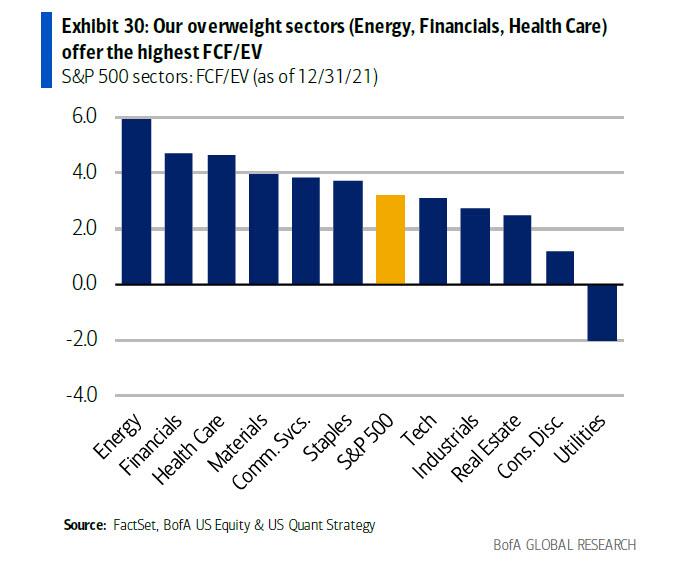
What offers the highest FCF/EV? Energy, Financials and Health Care (our three overweight sectors).
https://ift.tt/Nq9BFZ6
from ZeroHedge News https://ift.tt/Nq9BFZ6
via IFTTT


0 comments
Post a Comment